Consolidated Management Report
Consolidated Financial Statements
Milestones and main figures for the year 2019
Growth
2019, a year of transformational growth
During 2019 Cellnex struck several agreements to acquire assets and companies which, once signed and with all the associated programme for the construction of new sites rolled out, will mean an increase of some 24,000 assets in the current portfolio in the seven European countries in which the company is present.
In the first half of 2019, Cellnex signed long-term strategic collaboration agreements with Iliad in France and Italy and with Salt in Switzerland to acquire 10,700 sites (5,700 in France, 2,200 in Italy and 2,800 in Switzerland) and roll out a construction programme (BTS) of 4,000 new sites up to 2027 (2,500 in France and 1,000 in Italy for Iliad, and 500 for Salt in Switzerland). With a total planned investment of close to EUR 4 billion (EUR 2.7 billion for the acquisition of sites and EUR 1.3 billion for BTS programmes).
In June Cellnex and BT announced that they had signed a long-term strategic collaboration agreement through which Cellnex acquired the operation and marketing rights of 220 tall telecoms towers in the UK. The agreement additionally includes a commitment to explore further opportunities between the two companies in the UK, which consists of the pre-emptive right of acquisition of up to 3,000 sites from BT during the next six years (The “Right of First Offer”). In addition, according to the agreement, Cellnex will have a period of time in which to make a further and final offer, to match with a third party offer (The “Right to Match”), that BT could receive regarding these 3,000 sites.
In September Cellnex announced the acquisition of Cignal in Ireland, one of the main Irish telecommunications infrastructure operators, for a total of EUR 210 million. Cignal operates 546 sites in Ireland, which is now the seventh European country in which Cellnex has started operating. Furthermore, the Company expects to roll out another 600 new sites up to 2026, with an additional investment estimated at EUR 60 million.
In October, the Company announced the agreement to acquire Arqiva’s telecommunications division for around GBP 2 billion. The transaction includes 7,400 owned sites and acquiring the marketing rights of some 900 sites in the United Kingdom. It also includes concessions for the use of urban fixtures for the deployment in 14 districts of London for telecommunications infrastructure, a key resource for the densification and roll-out of 5G. The finalisation of the operation - subject to the competition authorities obtaining the corresponding administrative authorisations, and other suspensive conditions - is planned for the second half of 2020.
Since the IPO in 2015, Cellnex has executed or committed investments worth around EUR 11.4 billion for the acquisition or construction - by 2027 - of up to 44,000 telecommunications infrastructures in addition to the sites that the Company had at that time.
Business lines. Main indicators for the period
Income from operations for the period ended on 31 December 2019 reached EUR 1,031 million, which represents a 15% increase over 2018 year-end. This increase was mainly due to the expansion of the above-mentioned telecom infrastructure services for mobile network operators.
TOTAL INCOME (MILLIONS OF EUROS)

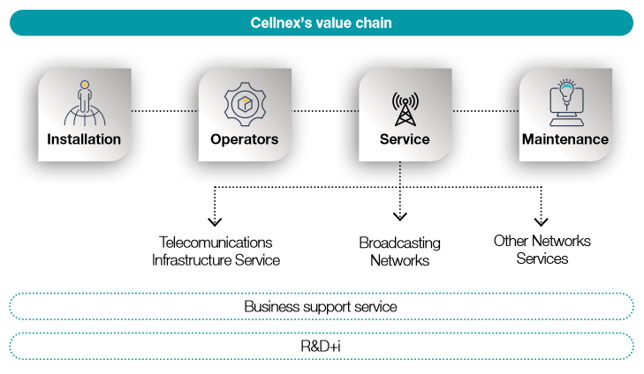
Telecom Infrastructure Services’ income increased by 19% to EUR 694 million due to both the organic growth achieved and the acquisitions performed during 2018 and 2019. This business segment is characterised by solid growth driven by increasing demand for wireless data communication services, and by the growing interest of mobile network operators (MNO) in developing high quality networks that fulfill their consumers' needs in terms of uninterrupted coverage and availability of wireless bandwidth (based on new Long-Term Evolution “LTE” technologies), in the most efficient way. In recent years the Group consolidated its infrastructure network and long-term strategic relationships with its main customers, the mobile network operators. In addition to its current portfolio Group’s Management has identified several potential acquisitions which are currently being analysed following its demanding capital deployment criteria. The Group owns a high-quality asset portfolio, which is made up of selective assets in all countries where it operates and performs the subsequent streamlining and optimisation of the tower infrastructure for Telecom Infrastructure Services. Its main added value proposals in this line of business consist of providing services to additional mobile network operators in its towers and therefore streamlining the customer’s network. By increasing the ratio of customers to infrastructures, the Group will generate additional income with very little additional costs. This network streamlining may generate significant efficiencies for the Group and for the MNOs.
With regard to the Broadcasting Infrastructure business, income amounted to EUR 235 million which represents a 1% increase compared with 2018 year-end, mainly due to the works related to second digital dividend as explained in section “Milestones 2019 – Broadcasting Infrastructure”. Even though Broadcast Infrastructure activity is a mature business in Spain, has demonstrated resilience to new additional TV consumption models.
Other Network Services increased its income by 23%, to EUR 101 million. This constitutes a specialised business that generates stable cash flows with attractive potential for growth. Taking into account the critical nature of the services in which the Group collaborates, its customers require in-depth technical know-how that is reflected in the demanding service level agreements. The Group considers that it has a privileged market presence and geographical distribution, established relationships with government agencies and excellent infrastructure for emergencies and public services. The Group's aim is to maintain long-term relationships with its customers maximise the renewal rate of its contracts and expand its business through new contracts. The Group classifies Other Network Services into five groups: (i) connectivity services; (ii) PPDR services; (iii) operation and maintenance; (iv) Smart Cities/IoT (“Internet of Things”); and (v) other services. During the second half of 2018, Cellnex incorporated the XOC, a concessionary company dedicated to the management, maintenance and construction of the fiber optic network of the Generalitat de Catalunya.
All of the above has helped boost operating income and operating profit, with the latter also being impacted by the measures to improve efficiency and optimise operating costs.
In line with the increase in revenue, Adjusted EBITDA was 16% higher than the 2018 year-end which reflects the Group’s capacity to generate cash flows on a continuous basis.
Operating profit increased by 27% compared with 2018 year-end mainly due to the reorganisation plan agreed during the first quarter of 2018 in order to adjust the workforce in its Spanish subsidiaries Tradia and Retevisión, which manage the terrestrial television infrastructure network (see Note 17.b of the accompanying consolidated financial statements), as well as due to the increase of the Adjusted EBITDA, partially offset by the higher depreciation and amortisation derived from the acquisition of telecom infrastructures during 2019.
Moreover, the net financial loss increased by 32%, derived largely from the increase in the Group’s bond issues and loans and credit facilities during 2019. On the other hand, the income tax for 2019 includes the effect of updating the tax rate of certain subsidiaries, which has resulted in a positive impact of EUR 19 million in the accompanying consolidated income statement, among other effects (see Note 16 of the accompanying consolidated financial statements).
Taking into account these considerations, the consolidated loss attributable to shareholders on 31 December 2019 stood at EUR 9 million (EUR 15 million at 31 December 2018).
Consolidation in Europe
Internationalising via mergers and acquisitions is a basic pillar of the Cellnex strategy.
In 2019, Cellnex continued expanding its presence in Europe, and by the end of the year 60% of Adjusted EBITDA was generated outside Spain (56% of Adjusted EBITDA was generated outside Spain at the 2018 year-end).
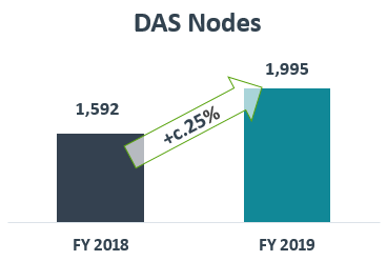
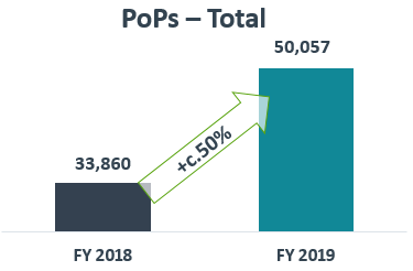
The Group’s business presents significant barriers to entry into its main markets, mainly due to its difficult-to-replicate total asset base of 36,471 sites and 1,995 nodes, which make a total of 38,466 infrastructures.
The main changes in the consolidation perimeter, together with assets purchased during financial year 2019 are as follows:
France
Iliad France Acquisition
In the first half of 2019, the Group entered into a long-term industrial alliance with the Iliad7 group of companies by virtue of which, Cellnex, through its fully owned subsidiary Cellnex France Groupe, has acquired the 70% of the share capital of Iliad 7, S.A.S. (“Iliad7”), owner of approximately 5,700 sites located in France. Additionally, Cellnex has agreed to the deployment of 2,500 sites in France in a seven-year term.
The actual cash outflow for Cellnex in relation to this transaction (Enterprise Value) has been EUR 1.4 billion (see Note 5 of the accompanying consolidated financial statements).
The 30% remaining non-controlling interest in Iliad7 can be purchased by Cellnex France Groupe at a price to be calculated pursuant to the shareholder agreement between the two parties. The price of this potential acquisition will undoubtedly be subject to inflationary pressure given the favourable performance of such assets.
The transaction has been completed in December 2019, once several administrative authorizations has been satisfied.
Agreements reached during 2016, 2017 and 2018
At 31 December 2019, in accordance with the agreements reached with Bouygues during 2016, 2017 and 2018, Cellnex, through its subsidiaries Cellnex France and Towerlink France, has committed to acquire and build up to 5,250 sites that will be gradually transferred to Cellnex until 2024 (see Note 6 of the accompanying consolidated financial statements). Of the proceeding 5,250 sites, a total of 3,504 sites have been transferred to Cellnex as at 31 December 2019.
Switzerland
Swiss Infra Acquisition
In the first half of 2019, the Group entered into a long-term industrial alliance with Matterhorn Telecom, S.A. (“Matterhorn”) by virtue of which Swiss Towers purchased 90% of the share capital of Swiss Infra Services SA (“Swiss Infra”) owner of approximately 2,800 sites located in Switzerland for a total amount of approximately EUR 770 million. Additionally, Cellnex agreed to the deployment of 500 additional sites in Switzerland in an eight-year term.
The 10% remaining non-controlling interest in Swiss Infra Services can be purchased by Swiss Towers at a price to be calculated pursuant to the corresponding shareholder agreement. The price of this potential acquisition will undoubtedly be subject to inflationary pressure given the favourable performance of such assets.
This transaction was completed in the second half of 2019, following the satisfaction of the closing conditions which included the granting of several administrative authorizations.
Other agreements
At 31 December 2019, in accordance with the agreement reached with Sunrise during 2018, Cellnex, through its subsidiaries Swiss Towers, has acquired 133 sites in Switzerland for an amount of CHF 39 million (EUR 34 million).
Italy
Iliad Italy Acquisition
In the first half of 2019, the Group entered into a long-term industrial alliance with the Iliad group of companies by virtue of which, Cellnex entered into an agreement to acquire (through its fully owned subsidiary Galata) a business unit containing approximately 2,200 sites located in Italy from Iliad Italia, S.p.A. for an estimated aggregate consideration of approximately EUR 600 million, (the “Iliad Italy Acquisition”). Additionally, Cellnex has agreed, to the deployment of 1,000 sites in Italy in a seven-year term.
The transaction has been completed in December 2019, once several administrative authorizations have been satisfied.
The transfer of the aforementioned business unit will be performed in one or more tranches, and the infrastructures involved are being gradually integrated into, and operated by Galata. This gradual process allows for the completion of formal administrative procedures with landlords and local administrations. As of 31 December 2019 approximately 80% of the total sites have been transferred to Cellnex.
Other agreements
During 2019, the agreement with Wind Tre dated 27 February 2015 was extended, through an increase of the built-to-suit project up to 800 additional sites to be built (increasing the agreement to build sites from up to 400 to up to 1.200 sites, with a total investment of up to EUR 70 million).
Spain
On 3 December 2019, Cellnex has reached an agreement with Orange Espagne, S.A.U. (“Orange Spain”) for the acquisition of 1,500 telecom sites in Spain for a total amount of EUR 260 million. As of 31 December 2019, 1,067 sites have been transferred to Cellnex for an amount of EUR 185 million, while the remaining 433 sites will be transferred during January 2020.
This project is fully aligned with Cellnex’s growth strategy and is also fully compliant with the Company’s strict value creation criteria.
In addition, in the last quarter of 2019, Cellnex Telecom and El Corte Inglés (“ECI”)I signed a long-term strategic agreement according to which Cellnex acquired the rights to operate and market approximately 400 buildings located mainly throughout Spain for a period of 50 years. The acquisition price amounted to approximately EUR 60 million, approximately. The aforementioned rights have been totally transferred to Cellnex as of 31 December 2019.
The Netherlands
On Tower Netherlands subgroup Acquisition
During the second half of 2019, Cellnex Telecom (through its subsidiary Cellnex Netherlands BV) reached an agreement to acquire 100% of the On Tower Netherlands subgroup for an amount of EUR 40 million (Enterprise Value). As a result of the acquisition, Cellnex directly owns all the shares of On Tower Netherlands BV and, consequently, all the shares of its subsidiaries. The actual cash outflow in relation to this transaction was EUR 39 million following the incorporation of EUR 1 million of cash balances on the balance sheet of the acquired subgroup. As a result of this acquisition, Cellnex acquired 114 additional infrastructures.
United Kingdom
During 2019, Cellnex Telecom (through its subsidiary Cellnex Connectivity Solutions Limited) and British Telecommunications PLC (“BT”) signed a long-term strategic agreement according to which Cellnex acquired the rights to operate and market 220 high towers located throughout the United Kingdom for a period of 20 years. The acquisition price amounted to GBP 70 million, approximately (with a Euro value of EUR 79 million). The aforementioned rights have been totally transferred to Cellnex as of 31 December 2019 (See Note 7 of the accompanying consolidated financial statements).
The agreement additionally includes a commitment to explore further opportunities between the two companies in the UK, which consists of the pre-emptive right of acquisition of up to 3,000 sites from BT during the next six years (The “Right of First Offer”). In addition, according to the agreement, Cellnex will have a period of time in which to make a further and final offer, to match with a third party offer (The “Right to Match”), that BT could receive regarding these 3,000 sites. The corresponding value assigned by Cellnex in relation to both Right of First Offer and Right to Match, amounted to GBP 30 million, approximately (with a Euro value of EUR 34 million).
Ireland
Cignal Acquisition
During the second half of 2019, Cellnex Telecom acquired 100% of the share capital of Cignal from InfraVia Capital Partners, owner of 546 sites in Ireland for a total amount of EUR 210 million (Enterprise Value). Additionally, Cignal will deploy up to 600 new additional sites by 2026.
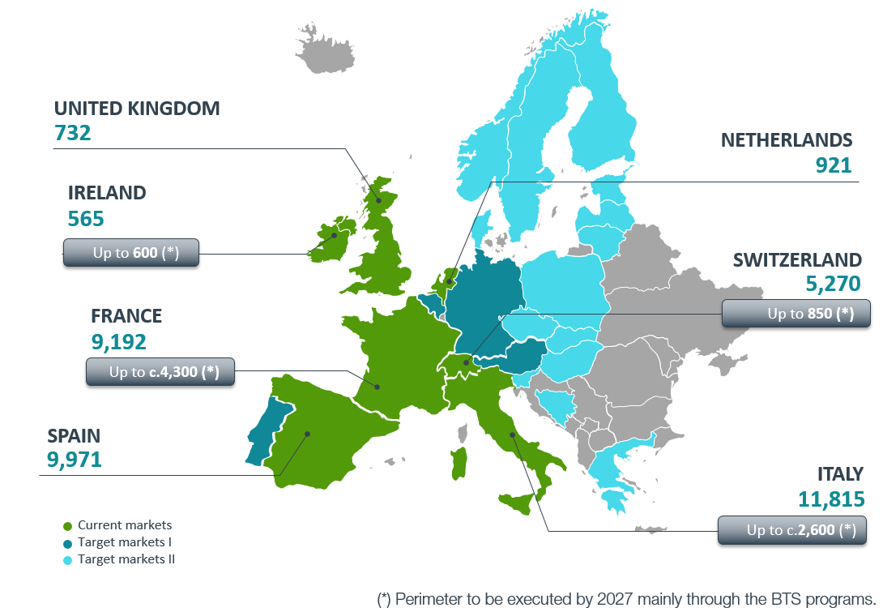
At 31 December 2019, the total number of Cellnex infrastructures acquired and build (sites and nodes) in Europe was as follows:
Transformation. Towards a new industrial model
During 2019, the large companies in the telecommunications sector have made moves and decisions in line with a new business model within the framework of separating infrastructure management and service management. This trend is a confirmation of the model that Cellnex opted for since its flotation on the stock exchange in 2015, as an independent operator that is not controlled by an MNO (Mobile Network Operator).
In 2015 it was a commitment to validate with an element of "wish full thinking" because it was necessary for there to be a market of telecommunications towers so that Cellnex could acquire a share of the corresponding market and demonstrate the growth potential of the company.
Cellnex has diversified its business risk both geographically and at the customer level. This means that the company is increasingly present in more countries and with a higher geographic share, extends its customer base to other markets and maintains a growth strategy of customers with presence in different countries, with an increasingly cross of different cultures and working methods and with the possibility of creating a stable relationship among the involves parties. In this sense, during 2019, the company has significantly increased its presence in Italy, France, Switzerland, the UK and Spain, and has even entered new markets such as Ireland.
In the meantime, from the outset, Cellnex has been characterised by promoting activities of a transformational nature, in search of excellence. Thus, each year the company re-evaluates the status of its ongoing initiatives, draws conclusions and lessons learned, and uses them to implement improvements in the various areas.
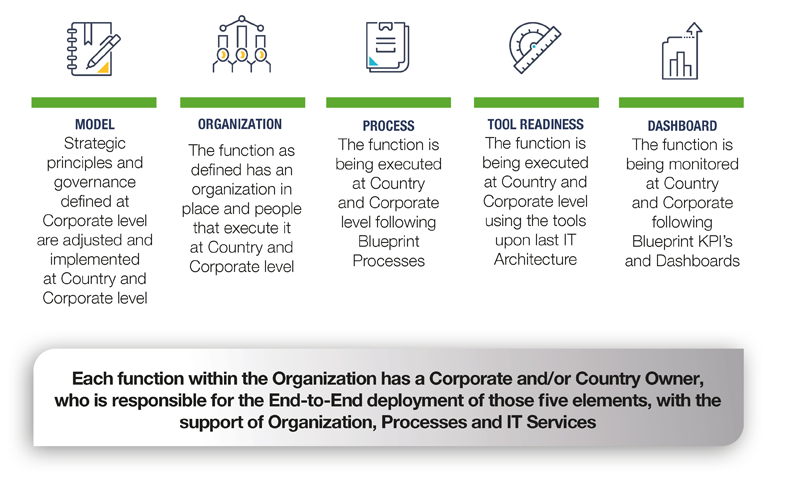
In 2018 the company's new Industrial Model was published, which considers an End-to-End vision of five elements: guidelines, organization, processes, tool and dashboard. These pillars allow us to industrialize each of Cellnex's key functions.
Along these lines, publishing the new Industrial Model in 2018 meant redefining the company's Transformation Programme to adjust to the levers of the model, which was structured into 16 initiatives grouped into 3 axes: Global Commercial, Global Operational and Global Governance.
In 2019, the initiatives included in the Transformation programmes were continued and the company has implemented a series of new lines of action identified for all the areas of the company, to define new transformational ideas. This year the Transformation Office (PMO) has defined, planned and monitored the execution of the transformation programs, reporting on a bimonthly basis to the Transformation Committee the state of progress, milestones and next steps for each of the programs.
In addition, this Transformation Office will be in charge of reviewing and guaranteeing the implementation of the industrial model in all the functions of Cellnex according to the five pillars defined in the model. The monitoring of the implementation will be done by applying Project Management methodology through the development of dashboards.
The eleven transformation programs defined for 2019 are articulated on three axes: commercial, operational and governance, and they have as a high-level target the implementation of Cellnex's industrial model.
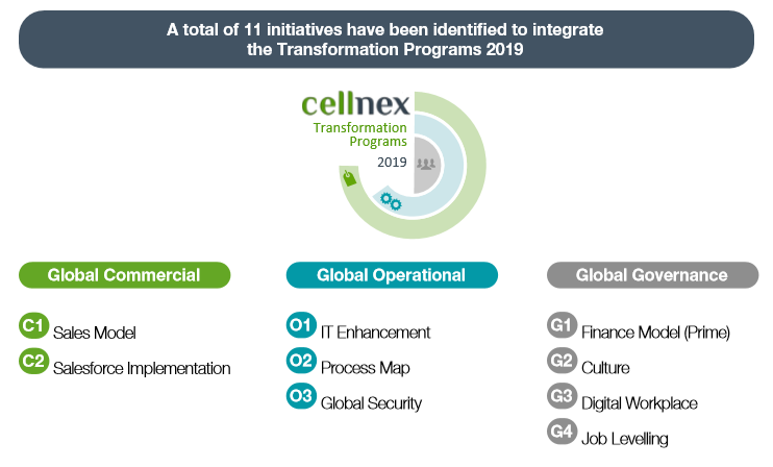
The Global Commercial axis consists of two initiatives: the Sales Model, which sets up Business Lines of the new Sales Model Global and the Salesforce Implementation in countries (explained in section “Customers”).
The Global Operational axis includes three subprogrammes:
- IT Enhancement: A new IT platform has been designed and deployed to manage the TIS operations and improve the quality of the IT Service. The IT platform allows us to potentiate collaboration, improve user experience and increase group efficiency, improving the quality of the IT Service.
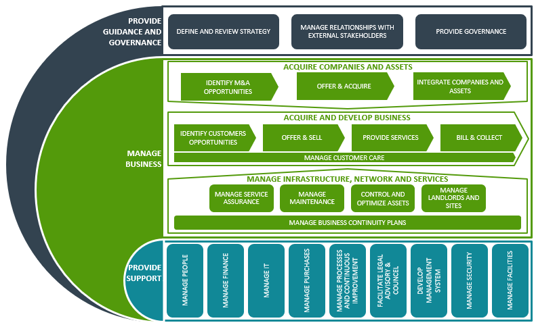
- Process Map: Cellnex's global process map has been adapted in 2019, giving visibility to inorganic growth and infrastructures and networks, key aspects for the Cellnex group and including innovation as part of Cellnex's strategy. This new global process map contributes to the implementation of Cellnex's industrial model in all key functions in the different business units and allows us to be certified globally as an industrial group. In the same way, this map will be implemented in all countries along with the systems that support them. Therefore, a key aspect during 2020 will be change management.
- Global Security: It is explained in section “Information security management”.
The Global Governance axis comprises the initiatives related to:
- Finance Model: The initiative consists on the definition, standardization and implementation of the new industrial model for areas of Treasury & Administration and establish a scalable model to support the group growth.
- Culture, Digital Workplace and Job Levelling: See section on “Culture, leadership and people development”. In this regard, we are working to develop and deploy a Corporate Culture built on the values that best define the company and our employees.
In 2020, the Transformation Office will conclude and present the results of the transformation programs implemented in 2019 and will define the new Cellnex transformation programs with the criterion of initiatives with a highly transformational component, due to the evolution in the maturity of the company's transformation.
New Corporate offices model
Furthermore, the current rate of growth of the company has undertaken the design and move to new offices in Rome and Zurich in 2019. These new offices respond not only to growth issues but also to grouping different work centres that allow the integration and industrialization of different business units. On the other hand, they are a good opportunity to reinforce the Cellnex’s brand and to continue consolidating a common culture throughout the Group.
In addition, the recent acquisitions and integration processes taking place in Cellnex lead to the design and occupation of new offices in France, Netherlands and the UK, and in Barcelona (2021). In line with the new offices deployed in 2019, they will also opt for open spaces that allow collaboration, the digital transformation of workplaces and well-being for our employees. During 2020, work will be done on the design and deployment of a new corporate office in Barcelona. The new office will be located in the BcnFira District.
These new offices aim to strengthen the Cellnex’s brand and bet on a new way of designing corporate spaces that adapt to the current and future needs of the Group, and promote the new ways of working that are in place nowadays
Some of the initiatives included in the design project for the new corporate headquarters in Barcelona are:
- Free seating - the non-fixed allocation of workplaces will allow informal meetings between the members of aproject and more flexibility when it comes to occupying work spaces.
- Paperless - the implementation of a free seating policy necessarily goes hand in hand with a commitment to paper lessness and order in the workplace.
- The aim is to encourage the existence of new spaces: phone booth, concentration spaces, cooperation and collaboration spaces, more diversity in meeting room formats, etc.
- More flexible organisation - organisational barriers that differentiate jobs are eliminated
AS OF 31 DECEMBER 2019, THE ORGANISATIONAL STRUCTURE OF THE CELLNEX GROUP IS AS FOLLOWS:
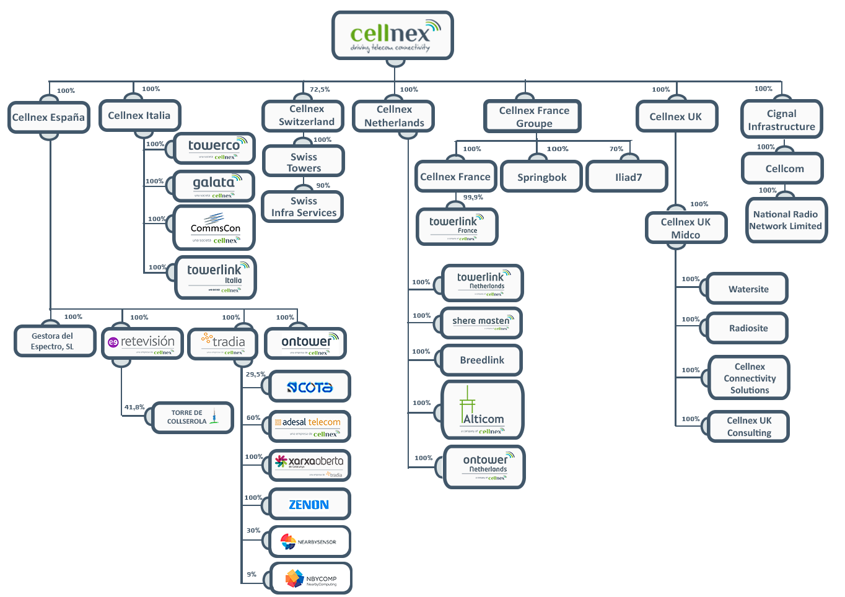
Details of the Group's subsidiaries and associated companies as of 31 December 2019, together with the percentages of stakeholding, are shown in Appendices I and II respectively of the accompanying consolidated annual accounts.
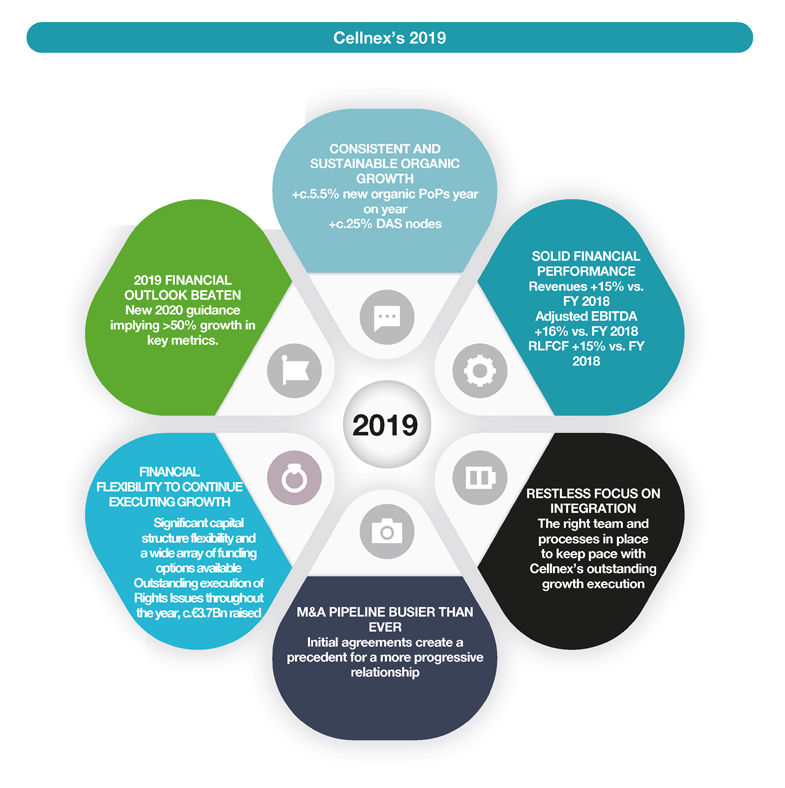
View of 2019
Market figures: Cellnex on the stock market
On 20 June 2016, the IBEX 35 Technical Advisory Committee approved Cellnex Telecom’s (CLNX: SM) inclusion in the benchmark index of Spain’s stock exchange, the IBEX 35, which brings together the principal companies on the Spanish stock exchange in terms of capitalisation and turnover. This milestone brought with it a broadening of the shareholder base, giving Cellnex higher liquidity and making it more attractive to investors. At present Cellnex has a solid shareholder base and the majority consensus of analysts who follow our company +50% - is a recommendation to buy.
As at 31 December 2019, the share capital of Cellnex Telecom increased by EUR 38,411 thousand to EUR 96,332 thousand (EUR 57,921 thousand at the end of 2018), represented by 385,326,529 cumulative and indivisible ordinary registered shares of EUR 0.25 par value each, fully subscribed and paid (see Note 12.a of the accompanying consolidated financial statements).
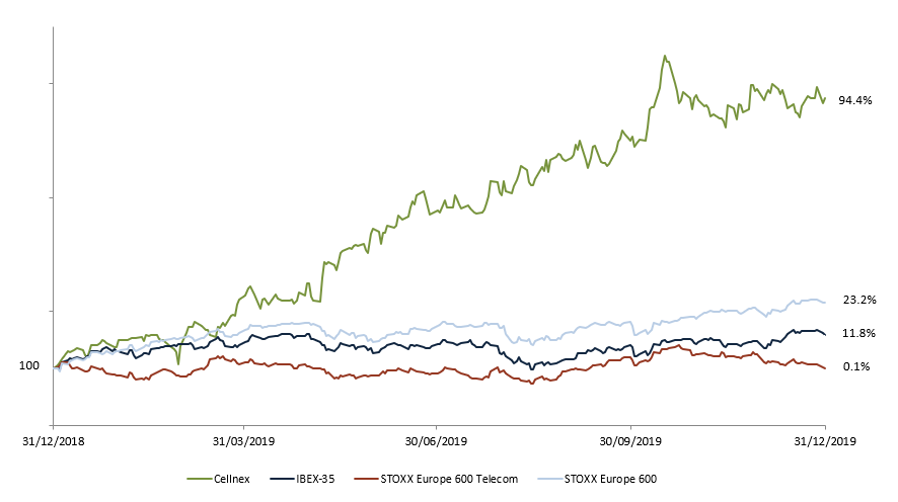
Cellnex’s share price experienced a 94% increase during 2019, closing at EUR 30.2 per share. The average volume traded has been approximately 1,040 thousand shares a day. The IBEX 35, STOXX Europe 600 and the STOXX Europe 600 Telecom increased by 11.8%, 23.2% and 0.1% during the same period.
Cellnex's market capitalization stood at EUR 14,784 million at the year ended on 31 December 2019, 356% higher than at start of trading on 7 May 2015, compared to a 14% drop in the IBEX 35 in the same period.
The evolution of Cellnex shares during 2019, compared to the evolution of IBEX 35, STOXX Europe 600 and STOXX Europe 600 Telecom, is as follows:
THE DETAIL OF THE MAIN STOCK MARKET INDICATORS OF CELLNEX IN 31 DECEMBER 2018 AND 2017 IS AS FOLLOWS:
31 December 2019 |
31 December 2018 |
|
Number of shares |
385,326,529 |
231,683,240 |
Stock market capitalisation at period/year end (millions of euros) |
14,784 |
5,187 |
Share price at close (EUR/share) |
38.37 |
22.39 |
Maximum share price for the period (EUR/share) |
41.29 |
24.52 |
Date |
16/10/2019 |
29/11/2018 |
Minimum share price for the period (EUR/share) |
19.9 |
19.7 |
Date |
02/01/2019 |
13/02/2018 |
Average share price for the period (EUR/share) |
30.24 |
22.26 |
Average daily volume (shares) |
1,039,628 |
769,574 |
Treasury shares
In accordance with the authorisation approved by the Board of Directors, at 31 December 2019 the Company held 199,943 of treasury shares (0.052% of its share capital). The use to which the treasury shares will be put has not been decided upon and will depend on such resolutions as might be adopted by the Group's governing bodies.
During 2019, the treasury shares transactions carried out, are disclosed in Note 12.a to the accompanying consolidated financial statements.
Business performance and results
The year ended on 31 December 2019 highlights the strong alignment between the objectives set and the results achieved, given that the Group considers as a key element the integration of this growth into its management processes, ensuring that it can guarantee and deliver quality service to customers.
Alternative Performance Measures
An Alternative Performance Measure (APM) is a financial measure of historical or future financial performance, financial position, or cash flows, other than a financial measure defined or specified in the applicable financial reporting framework.
Cellnex believes that there are certain APMs, which are used by the Group’s Management in making financial, operational and planning decisions, which provide useful financial information that should be considered in addition to the financial statements prepared in accordance with the accounting regulations that apply (IFRS-EU), in assessing its performance. These APMs are consistent with the main indicators used by the community of analysts and investors in the capital markets.
In accordance with the provisions of the Guide issued by the European Securities and Markets Authority (ESMA), in force since 3 July, 2016, on the transparency of Alternative Performance Measures, Cellnex below provides information concerning those APMs it considers significant: Adjusted EBITDA; Adjusted EBITDA Margin; Gross and Net Financial Debt; Maintenance, Expansion and M&A CAPEX; and Recurring leveraged free cash flow.
The definition and determination of the aforementioned APMs are disclosed in the accompanying consolidated financial statements, and therefore, they are validated by the Group auditor.
Adjusted EBITDA
Relates to the “Operating profit” before “Depreciation and amortisation charge” (after IFRS 16 adoption) and after adding back (i) certain non-recurring items (such as cost related to acquisitions, contract renegotiation and redundancy provision) or (ii) certain non-cash items (such as advances to customers, prepaid expenses and LTIP remuneration payable in shares).
The Company uses Adjusted EBITDA as an operating performance indicator as it is considered a measure that best represents the cash generation of its business units and which is widely used as an evaluation metric among analysts, investors, rating agencies and other stakeholders. At the same time, it is important to highlight that Adjusted EBITDA is not a measure adopted in accounting standards and, therefore, should not be considered an alternative to cash flow as an indicator of liquidity. Adjusted EBITDA does not have a standardised meaning and, therefore, cannot be compared to the Adjusted EBITDA of other companies.
The Company presents comparative financial information from previous year as detailed in Note 2.e of the accompanying Consolidated Financial Statements.
As at 31 December 2019 and 2018, respectively, the amounts are as follows:
ADJUSTED EBITDA (THOUSANDS OF EUROS)
|
31 December 2019 |
31 December 2018 |
Telecom Infrastructure Services |
694,248 |
582,758 |
Broadcasting infrastructure |
235,383 |
232,773 |
Other Network Services |
101,214 |
82,340 |
Operating income |
1,030,845 |
897,871 |
|
|
|
Staff costs |
(144,171) |
(172,650) |
Repairs and maintenance |
(35,596) |
(32,223) |
Leases |
(11,102) |
(11,537) |
Utilities |
(84,798) |
(72,312) |
General and other services |
(111,872) |
(93,773) |
Depreciation and amortisation charge |
(500,814) |
(402,846) |
Operating profit |
142,492 |
112,530 |
|
|
|
Depreciation and amortisation |
500,814 |
402,846 |
Non-recurring expenses |
38,461 |
72,067 |
Advances to customers |
3,790 |
3,383 |
Adjusted operating profit before depreciation and amortisation charge (Adjusted EBITDA) |
685,557 |
590,826 |
Costs related to acquisitions, which mainly includes expenses incurred during acquisition processes (non-recurring item), amounted to EUR 19,208 thousand (13,607 at 2018 year-end).As at 31 December 2019 and 2018, non-recurring expenses and advances to customers are set out below (see in Note 18.d of the accompanying consolidated financial statements):
- Tax associated with acquisitions, which relates to the stamp duty paid on the acquisition in Ireland (non-recurring item) amounted to EUR 1,077 thousand (0 at 2018 year-end).
- Service contract cancellation cost, which relates to the cancellation expense concerning the change of the administration and treasury services provider, amounted to EUR 1,545 thousand (0 at 2018 year-end). This change took place in order to implement a new industrial model at Group level, to guarantee the optimization and standardization of policies, processes and procedures in all the countries (non-recurring item).
- Redundancy provision, which mainly includes the impact in 2019 and 2018 year-end derived from the reorganisation plan detailed in Note 17.b of the accompanying consolidated financial statements (non-recurring item), amounted to EUR 5,552 thousand (56,160 at 2018 year-end).
- Extra compensation and benefits costs, which corresponds to extra non-conventional bonus for the employees (non-recurring item), amounted to EUR 5,117 thousand (0 at 2018 year-end).
- LTIP remuneration payable in shares, which corresponds to the LTIP remuneration accrued at the year-end, which is payable in Cellnex shares (See Note 17.b of the accompanying consolidated financial statements, non-cash item), amounted to EUR 5,962 thousand (2,300 at 2018 year-end).
- Advances to customers, which Includes the amortization of amounts paid for sites to be dismantled and their corresponding dismantling costs, amounted to EUR 3,790 thousand (3,383 at 2018 year-end). These costs are treated as advances to customers in relation to the subsequent services agreement entered into with the customer (mobile telecommunications operators). These amounts are deferred over the life of the service contract with the operator as they are expected to generate future economic benefits in existing infrastructures (non-cash item).
Adjusted EBITDA Margin
Corresponds to Adjusted EBITDA divided by total revenues excluding elements pass-through to customers (mostly electricity) from both expenses and revenues.
The Company presents comparative financial information from previous year as detailed in Note 2.e of the accompanying Consolidated Financial Statements.
According to the above, the Adjusted EBITDA Margin as at 31 December 2019 and 2018 was 67% and 66%, respectively.
Gross financial debt
The Gross Financial Debt corresponds to “Bond issues and other loans”, “Loans and credit facilities” and “Lease liabilities”, but does not include any debt held by Group companies registered using the equity method of consolidation, “Derivative financial instruments” or “Other financial liabilities”.
The Company presents comparative financial information from previous year as detailed in Note 2.e of the accompanying Consolidated Financial Statements.
According to the above, its value as at 31 December 2019 and 2018, respectively, is as follows:
GROSS FINANCIAL DEBT (THOUSANDS OF EUROS)
|
31 December 2019 |
31 December 2018 |
Bond issues and other loans (Note 13) |
3,501,124 |
2,510,176 |
Loans and credit facilities (Note 13) |
1,636,450 |
585,561 |
Lease liabilities (Note 14) |
1,152,027 |
526,337 |
Gross financial debt |
6,289,601 |
3,622,074 |
Net financial debt
Relates to “Gross financial debt” minus “Cash and cash equivalents”
Together with Gross Financial Debt, the Company uses Net Financial Debt as a measure of its solvency and liquidity as it indicates the current cash and equivalents in relation to its total debt liabilities. From the net financial debt, common used metrics are calculated such as the “Annualised Net Debt/12-month forward looking Adjusted EBITDA” which is frequently used by analysts, investors and rating agencies as an indication of financial leverage.
The Company presents comparative financial information from previous year as detailed in Note 2.e of the accompanying Consolidated Financial Statements.
The “Net financial debt” at 31 December 2019 and 2018 is detailed in Section “Liquidity and Capital Resources” of this Consolidated Management Report.
Capital expenditures
Maintenance capital expenditures
Corresponds to investments in existing tangible or intangible assets, such as investment in infrastructure, equipment and information technology systems, and are primarily linked to keeping sites in good working order, but which excludes investment in increasing the capacity of sites.
Expansion capital expenditures
Includes site adaptation for new tenants, ground leases (cash advances and renegotiations), and efficiency measures associated with energy and connectivity, and early site adaptation to increase the capacity of sites. Thus, it corresponds to investments related to business expansion that generates additional adjusted EBITDA.
Expansion capital expenditures (Build to Suit programs)
Includes Built to Suit committed with different MNO’s (like Bouygues Telecom, Sunrise, Iliad and Salt, among others), at the moment of the closing of the M&A projects or the corresponding new extensions.
M&A capital expenditures
Corresponds to investments in shareholdings of companies as well as significant investments in acquiring portfolios of sites or lands (asset purchases).
Total capital expenditure for the period ended 31 December 2019 and 2018, including property, plant and equipment, intangible assets, advance payments on ground leases and business combinations are summarised as follows:
TOTAL INVESTMENT (THOUSANDS OF EUROS)
31 December 2019 |
31 December 2018 |
|
Maintenance capital expenditures |
40,556 |
30,653 |
Expansion capital expenditures |
97,110 |
93,764 |
Expansion capital expenditures (Build to Suit programs) |
229,500 |
147,341 |
M&A capital expenditures |
3,663,285 |
395,305 |
Total investment |
4,030,451 |
667,063 |
Recurring leveraged free cash flow
The Company considers that the recurring leveraged free cash flow is one of the most important indicators of its ability to generate stable and growing cash flows which allows it to guarantee the creation of value, sustained over time, for its shareholders. The criteria used to calculate the Recurring leveraged free cash flow is the same as the previous year.
The Company presents comparative financial information from previous year as detailed in Note 2.e of the accompanying Consolidated Financial Statements.
At 31 December 2019 and 2018 the Recurring Leveraged Free Cash Flow (“RLFCF”) was calculated as follows:
RECURRING LEVERAGED FREE CASH FLOW (THOUSANDS OF EUROS)
31 December 2019 |
31 December 2018 |
|
Adjusted EBTIDA (1) |
685,557 |
590,826 |
Payments of lease instalments in the ordinary |
(192,038) |
(166,493) |
Maintenance capital expenditures (3) |
(40,556) |
(30,653) |
Changes in current assets/current liabilities (4) |
(99) |
2,034 |
Net payment of interest (5) |
(76,925) |
(64,503) |
Income tax payment (6) |
(25,262) |
(20,219) |
Net dividends to non-controlling interests (7) |
(699) |
(6,274) |
Recurring leveraged free cash flow (RLFCF) |
349,978 |
304,718 |
Expansion Capex (8) |
(97,110) |
(93,764) |
Expansion Capex (Build to Suit programs) (9) |
(229,500) |
(147,341) |
M&A Capex (cash only) (10) |
(3,659,031) |
(392,125) |
Non-Recurrent Items (cash only) (11) |
(30,827) |
(45,048) |
Net Cash Flow from Financing Activities (12) |
5,597,960 |
553,370 |
Other Net Cash Out Flows (13) |
(35,785) |
(19,113) |
Net Increase of Cash (14) |
1,895,685 |
160,697 |
(1) Adjusted EBITDA: Profit from operations before D&A (after IFRS 16 adoption) and after adding back (i) certain non-recurring items (such as cost related to acquisitions (€19Mn), tax associated with acquisitions (€1Mn), service contract cancelation cost (€2Mn), extra compensation and benefits costs (€5Mn) and redundancy provision (€5Mn)) or (ii) certain non-cash items (such as advances to customers (€4Mn) which include the amortisation of amounts paid for sites to be dismantled and their corresponding dismantling costs, and LTIP remuneration payable in shares (€6Mn)).
(2) Corresponds to i) payments of lease instalments (€122Mn) in the ordinary course of business and; ii) interest payments on lease liabilities (€70Mn). See Note 14 of the accompanying Consolidated Financial Statements.
(3) Maintenance capital expenditures: investment in existing tangible or intangible assets, such as investment in infrastructure, equipment and information technology systems, and are primarily linked to keeping sites in good working order, but which excludes investment in increasing the capacity of sites.
(4) Changes in current assets/current liabilities (see the relevant section in the Consolidated Statement of Cash Flows for the year ended 31 December 2019).
(5) Corresponds to the net of “Interest paid” and “interest received” in the accompanying Consolidated Statement of Cash Flows for the year ended 31 December 2019). This amount corresponds to net interest payments (€77Mn), which do not include “Interest payments on lease liabilities” (€70Mn) (see Note 14 of the accompanying consolidated financial statements).
(6) Income tax payment (see the relevant section in the accompanying Consolidated Statement of Cash Flows for the period ended 31 December 2019).
(7) Corresponds to the net of “Dividends to non-controlling interests” and “Dividends received” in the accompanying Consolidated Statement of Cash Flows for the period ended 31 December 2019.
(8) Expansion capital expenditures: Ground lease renegotiations (€45Mn), efficiency measures associated with energy and connectivity (€13Mn), and others (including early site adaptation to increase the capacity of sites). Thus, it corresponds to investments related to business expansion that generates additional adjusted EBITDA.
(9) Committed Build to Suit Programs with several MNOs at the moment of the closing of the M&A project.
(10) M&A capital expenditures (cash only): Investments in shareholdings of companies as well as significant investments in acquiring portfolios of sites or land (asset purchases), after integrating into the consolidated balance sheet mainly the "Cash and cash equivalents" of the acquired companies. The amount resulting from: (3)+(8)+(9)+(10) corresponds to “Total Investment” (see caption “Capital Expenditures” in the accompanying Consolidated Financial Statements for the year ended 31 December 2019) minus the “Cash and cash equivalents” of the acquired companies (4Mn) and; this sum also corresponds to “Total net cash flow from investing activities” (see the relevant section in the accompanying Consolidated Statement of Cash Flows for the year ended 31 December 2019), after adding mainly the Cash advances to landlords (€53Mn) (see Note 14 of the accompanying Consolidated Financial Statements), and excluding timing effects such as VAT related to assets purchases and the contribution of minority shareholders.
(11) Consists of "non-recurring expenses and advances to customers" that have involved cash movements, corresponding to "Costs related to acquisitions", “tax associated with acquisitions”, “service contract cancellation cost”, “extra compensation and benefits costs” and “Redundancy provision”.
(12) Corresponds to “Total net cash flow from financing activities”, which do not include “Net payment of lease liabilities” (174Mn€), “Dividends to non-controlling interests” (1Mn€) and “Dividends received” (0Mn€) (see the relevant section in the Consolidated Statement of Cash Flows for the year ended 31 December 2019).
(13) Mainly corresponds to the repayment of factoring, timing effects such as VAT related to assets purchases, registration tax in Italy, contribution of minority shareholders in Switzerland and “Foreign exchange differences” (see the relevant section in the Consolidated Statement of Cash Flows for the year ended 31 December 2019).
(14) “Net (decrease)/increase in cash and cash equivalents from continuing operations” (see the relevant section in the Consolidated Statement of Cash Flow for the year ended 31 December 2019)
Revenues and Results
Income from operations for the period ended on 31 December 2019 reached EUR 1,031 million, which represents a 15% increase over 2018 year-end. This increase was mainly due to the expansion of the above-mentioned telecom infrastructure services for mobile network operators.
Telecom Infrastructure Services’ income increased by 19% to EUR 694 million due to both the organic growth achieved and the acquisitions performed during 2018 and 2019. This business segment is characterised by solid growth driven by increasing demand for wireless data communication services, and by the growing interest of mobile network operators (MNO) in developing high quality networks that fulfil their consumers' needs in terms of uninterrupted coverage and availability of wireless bandwidth (based on new Long-Term Evolution “LTE” technologies), in the most efficient way. In recent years the Group consolidated its infrastructure network and long-term strategic relationships with its main customers, the mobile network operators. In addition to its current portfolio Group’s Management has identified several potential acquisitions which are currently being analysed following its demanding capital deployment criteria. The Group owns a high-quality asset portfolio, which is made up of selective assets in Spain, Italy, the Netherlands, France, the United Kingdom and Switzerland and performs the subsequent streamlining and optimisation of the tower infrastructure for Telecom Infrastructure Services. Its main added value proposals in this line of business consist of providing services to additional mobile network operators in its towers and therefore streamlining the customer’s network. By increasing the ratio of customers to infrastructures, the Group will generate additional income with very little additional costs. This network streamlining may generate significant efficiencies for the Group and for the MNOs.
With regard to the Broadcasting Infrastructure business, income amounted to EUR 235 million which represents a 1% increase compared with 2018 year-end. Broadcasting Infrastructure activities are characterised by predictable, recurring and stable cash flows. Although this is a mature business in Spain, broadcasting activities have shown considerable resilience to adverse economic conditions, such as those experienced in Spain in recent years, this is due to the fact that the Group's income does not depend directly on macroeconomic factors, but rather on the demand for radio and television broadcasting services by broadcasting companies. It should be noted that Cellnex is facing a general cycle of renewal of contracts with customers in the broadcasting area, although in recent years the relative weight of this segment has decreased significantly.
Other Network Services increased its income by 23%, to EUR 101 million. This constitutes a specialised business that generates stable cash flows with attractive potential for growth. Taking into account the critical nature of the services in which the Group collaborates, its customers require in-depth technical know-how that is reflected in the demanding service level agreements. The Group considers that it has a privileged market presence and geographical distribution, established relationships with government agencies and excellent infrastructure for emergencies and public services. The Group's aim is to maintain long-term relationships with its customers maximise the renewal rate of its contracts and expand its business through new contracts. The Group classifies Other Network Services into five groups: (i) connectivity services; (ii) PPDR services; (iii) operation and maintenance; (iv) Smart Cities/IoT (“Internet of Things”); and (v) other services. During the second half of 2018, Cellnex incorporated the XOC, a concessionary company dedicated to the management, maintenance and construction of the fiber optic network of the Generalitat de Catalunya.
All of the above has helped boost operating income and operating profit, with the latter also being impacted by the measures to improve efficiency and optimise operating costs.
In line with the increase in revenue, Adjusted EBITDA was 16% higher than the 2018 year-end which reflects the Group’s capacity to generate cash flows on a continuous basis.
Operating profit increased by 27% compared with 2018 year-end mainly due to the reorganisation plan agreed during the first quarter of 2018 in order to adjust the workforce in its Spanish subsidiaries Tradia and Retevisión, which manage the terrestrial television infrastructure network (see Note 17.b of the accompanying consolidated financial statements), as well as due to the increase of the Adjusted EBITDA, partially offset by the higher depreciation and amortisation derived from the acquisition of telecom infrastructures during 2019.
Moreover, the net financial loss increased by 32%, derived largely from the increase in the Group’s bond issues and loans and credit facilities during 2019. On the other hand, the income tax for 2019 includes the effect of updating the tax rate of certain subsidiaries, which has resulted in a positive impact of EUR 19 million in the accompanying consolidated income statement.
Taking into account these considerations, the consolidated loss attributable to shareholders on 31 December 2019 stood at EUR 9 million (EUR 15 million at 31 December 2018).
Consolidated Balance Sheet
Total assets at 31 December 2019 stood at EUR 13,000 million, a 153% increase compared with the year-end December 2018, mainly as a result of the asset purchases made during 2019 in France, Switzerland, Italy and the United Kingdom. Around 56% of total assets relates to property, plant and equipment and other intangible assets, in line with the nature of the Group’s business related to the management of terrestrial telecommunications infrastructure. The increase in property, plant and equipment and other intangible assets as a result of the above-mentioned acquisitions.
Consolidated net equity at 31 December 2019 stood at EUR 5,051 million, a 721% increase compared with the year-end December 2018, as a result of the capital increases amounting to EUR 3.7 billion carried out in March 2019 and November 2019 to finance the Group’s growth (as detailed in Note 12 of the accompanying consolidated financial statements).
In relation to bank borrowings and bond issues, Cellnex closed 2019 financial year with a debt structure marked by the flexibility provided by the various instruments that were used: low cost and high average life. The average life of this debt is 5.7 years, the approximate average cost is 1.7% (debt drawn), and 68% at a fixed rate.
The Group's net debt as of 31 December 2019 stood at EUR 3,937 million compared to EUR 3,166 million at the close of 2018. Likewise, at 2019 year-end Cellnex had access to immediate liquidity (cash & undrawn debt) to the tune of approximately EUR 6,6 billion.
Cellnex Telecom's bond issues maintain their "investment grade" rating from Fitch (BBB- with a stable outlook), confirmed by this agency in November 2019. For its part, S&P maintains the BB+ rating with stable perspective confirmed by the agency in October 2019.
Consolidated cash flow generation
Net Payment of Interest
The reconciliation of the caption “Net payment of interest” from the consolidated cash flow statement corresponding to the year ended on 31 December 2019 and 2018, with the “net interest expense” in the financial statements is as follows:
|
31 December 2019 |
31 December 2018 |
Interest Income (Note 18.f) |
1,254 |
3,461 |
Interest Expense (Note 18.f) |
(197,838) |
(152,285) |
Bond & loan interest accrued not paid |
54,462 |
44,582 |
Put Options – non-cash |
- |
5,676 |
Amortised costs – non-cash |
39,371 |
15,147 |
Interest accrued in prior year paid in current year |
(44,582) |
(35,538) |
Net payment of interest as per the Consolidated Statement of Cashflows |
(147,333) |
(118,957) |
Income Tax Payment
The reconciliation between the payment of income tax according to the consolidated statement of cashflows and the current income tax expense for 2019 and 2018 is as follows:
|
31 December 2019 |
31 December 2018 |
Current tax expense (Note 16.b) |
(14,555) |
(18,290) |
Payment of income tax prior year |
(3,950) |
(5,975) |
Receivable of income tax prior year |
1,048 |
1,318 |
Income tax (receivable)/payable |
(5,997) |
5,739 |
Others |
(1,808) |
(3,011) |
Payment of income tax as per the Consolidated Statement of Cashflows |
(25,262) |
(20,219) |
Business indicators
Information relating to the deferment of payments to suppliers
See Note 15 of the accompanying consolidated financial statements.
Use of financial instruments.
See Note 4 of the accompanying consolidated financial statements.
Sustained value creation
Creating value in the company
Cellnex´s Financial Structure
Cellnex’ borrowings are represented by a combination of loans, credit facilities and bonds issues. As at 31 December 2019, the total limit of loans and credit facilities available was EUR 5,877,303 thousand (EUR 1,606,398 thousand as of 31 December 2018), of which EUR 2,290,227 thousand in credit facilities and EUR 3,587,076 thousand in loans (EUR 1,287,415 thousand in credit facilities and EUR 318,983 thousand in loans as of 31 December 2018).
Cellnex´s Financial Structure (Thousands of Euros):
Notional as of 31 December 2019 (*) |
Notional as of 31 December 2018 (*) |
|||||
Limit |
Drawn |
Undrawn |
Limit |
Drawn |
Undrawn |
|
Bond issues and other loans |
3,600,500 |
3,600,500 |
- |
2,552,835 |
2,552,835 |
- |
Loans and credit facilities |
5,877,303 |
1,643,971 |
4,233,332 |
1,606,398 |
586.471 |
1,019,927 |
Total |
9,477,803 |
5,244,471 |
4,233,332 |
4,159,233 |
3,139,306 |
1,019,927 |
(*) These concepts include the notional value of each caption, and are not the gross or net value of the caption. See “Borrowings by maturity” of the Note 13 of the accompanying consolidated financial statements.
As at 31 December 2019, Cellnex weighted average cost of debt (considering both the drawn and undrawn borrowings) was 1.5% (1.9% as at 31 December 2018) and the weighted average cost of debt (considering only the drawn down borrowings) was 1.7% (2.2% as at 31 December 2018).
The following graph sets forth Cellnex’s notional contractual obligations in relation to borrowings as of 31 December 2019 (EUR million):
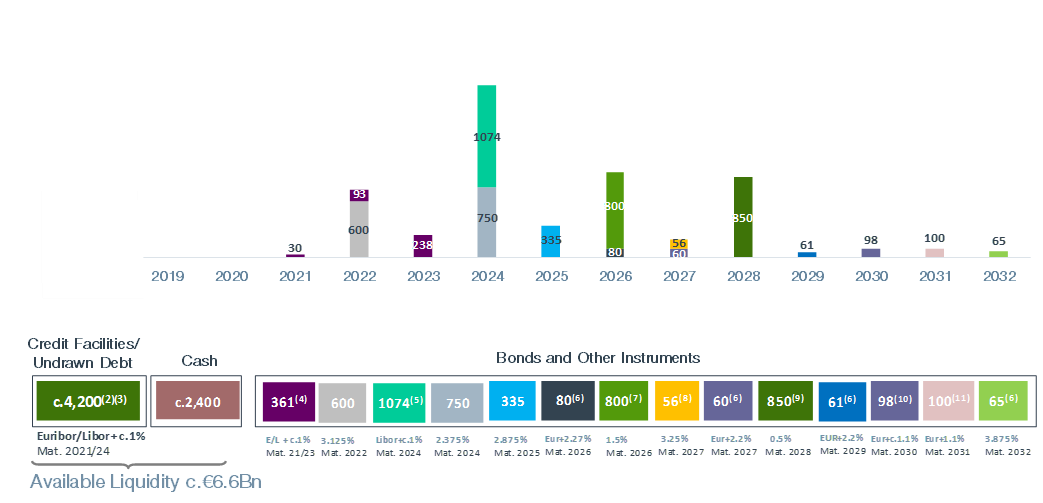
(1) Considering current Euribor rates; cost over full financing period to maturity.
(2) Including RCF €1,500Mn, c.€300Mn bilaterals and GBP 2Bn facilities agreement (€2.4 billion, assuming a GBP/€ 1.2 exchange rate), not yet drawn (if drawn upon the closing of the Arqiva deal will act as a natural hedge).
(3) RCF; Credit facilities Euribor 1M/3M; floor of 0% applies.
(4) Includes c.£330Mn debt in GBP; natural hedge investment in Cellnex UK Ltd.
(5) €583Mn debt in Swiss Francs at corporate level (natural hedge) ) + €491Mn debt in Swiss Francs at local level in Switzerland. No financial covenants or share pledge (Swiss Tower and/or Cellnex Switzerland) in line with all the debt placed at the Parent Company Corporate level.
(6) Private placement.
(7) Convertible bond into Cellnex shares (conversion price at c. €33.6902 per share). Includes 200Mn convertible issued in January 2019.
(8) Bilateral loan.
(9) Convertible bond into Cellnex shares (effective conversion price at c.€53.7753 per share).
(10) EIB loan.
(11) ICO Loan.
The Group’s borrowings were arranged under market conditions, therefore their fair value does not differ significantly from their carrying amount.
In accordance with the foregoing and with regard to the financial policy approved by the Board of Directors, the Group prioritizes securing sources of financing at Parent Company level. The aim of this policy is to secure financing at a lower cost and longer maturities while diversifying its funding sources. In addition, this encourages access to capital markets and allows greater flexibility in financing contracts to promote the Group’s growth strategy.
Liquidity and Capital Resources
Net financial debt
The “Net financial debt” at 31 December 2019 and 2018 is as follows:
NET FINANCIAL DEBT (THOUSANDS OF EUROS)
31 December 2019 |
31 December 2018 |
|
Gross financial debt (1) |
6,289,601 |
3,622,074 |
Cash and cash equivalents (Note 11) |
(2,351,555) |
(455,870) |
Net financial debt |
3,938,046 |
3,166,204 |
(1) As defined in Section “Business performance and results” of the accompanying Consolidated Management Report corresponding to the year ended on 31 December 2019.
At 31 December 2019, the net bank financial debt amounted to EUR 3,938 million (EUR 3,166 million in 2018), including a consolidated cash and short term deposits position of EUR 2,352 million (EUR 456 million in 2018).
Net financial debt evolution
NET FINANCIAL DEBT EVOLUTION
Net Debt Evolution (including accrued interest) |
31 December 2019 |
31 December 2018 |
Beginning of Period |
3,166,204 |
2,662,617 |
Recurring leveraged free cash flow |
(349,978) |
(304,718) |
Expansion Capex |
97,110 |
93,764 |
Expansion Capex (Build to Suit programs) |
229,500 |
147,341 |
M&A Capex (cash only) |
3,659,031 |
392,125 |
Non-Recurrent Items (cash only) |
30,827 |
45,048 |
Other Net Cash Out Flows |
35,785 |
19,113 |
Payment of Dividends (1) |
26,620 |
24,211 |
Treasury shares (2) |
- |
5,035 |
Issue of equity instruments |
(3,683,375) |
(62,480) |
Net repayment of other borrowings (3) |
26,978 |
11,220 |
Change in Lease Liabilities (4) |
625,690 |
100,355 |
Accrued Interest Not Paid and Others (non-cash) |
73,654 |
32,573 |
End of Period |
3,938,046 |
3,166,204 |
(1) “Dividends paid” (see the relevant section in the Consolidated Statement of Cash Flows for the period ended 31 December 2019).
(2) “Acquisition of treasury shares” (see the relevant section in the Consolidated Statement of Cash Flows for the period ended 31 December 2019).
(3) “Net repayment of other borrowings” (see the relevant section in the Consolidated Statement of Cash Flows for the period ended 31 December 2019).
(4) Changes in “Lease liabilities” long and short term of the accompanying Consolidated Balance Sheet as of 31 December 2019. See Note 14 of the accompanying Consolidated Financial Statements.
Liquidity availability
The breakdown of the available liquidity at 31 December 2019 and 2018 is as follows:
31 December 2019 |
31 December 2018 |
|
Available in credit facilities (Note 13) |
4,233,332 |
1,019,927 |
Cash and cash equivalents (Note 11) |
2,351,555 |
455,870 |
Available liquidity |
6,584,887 |
1,475,797 |
Regarding the Corporate Rating, at 31 December 2019, Cellnex holds a long term “BBB-“ (investment grade) with stable outlook according to the international credit rating agency Fitch Ratings Ltd. and a long-term “BB+” with stable outlook according to the international credit rating agency Standard & Poor’s Financial Services LLC.
Shareholder remuneration
On 31 May 2018 the AGM approved the distribution of a cash pay out to shareholders charged to the share premium reserve a maximum of EUR 63 million, payable in one or more instalments during the years 2018, 2019 and 2020. It was also agreed to delegate to the Board of Directors the authority to establish, if this is the case, the amount and the exact date of each payment during said period, always attending to the maximum overall amount stipulated.
During 2019, in compliance with the Company´s dividend policy, the Board of Directors, pursuant to the authority granted by resolution of the Annual Shareholders’ Meeting of 31 May 2018, approved the distribution of a cash pay-out charged to the share premium reserve of EUR 11,816 thousand, which represented EUR 0.03956 for each existing and outstanding share with the right to receive such cash pay-out. In addition, on 14 November 2019, the Board of Directors, approved the distribution of a dividend charged to the share premium reserve in the amount of EUR 14,804 thousand, which represented EUR 0.03842 per share.
Along with the final cash dividend of EUR 11,818 thousand to be paid in 2020 (pursuant to the corresponding approval by AGM), the total cash dividend distribution against 2019 results or reserves will have increased by 10% in relation to the dividend distributed against 2018 results or reserves.
The payment of the dividends will be made on the specific dates to be determined in each case and will be duly announced.
Notwithstanding the above, the Company’s ability to distribute dividends depends on a number of circumstances and factors including, but not limited to, net profit attributable to the Company, any limitations included in financing agreements and Company’s growth strategy. As a result, such circumstances and factors may modify this Dividend Policy. In any case, any future amendment on this policy will be duly announced.
The Dividend Policy aims at keeping the appropriate balance between, shareholder remuneration, Company’s profit generation and Company’s growth strategy, ensuring an adequate capital structure.
2017-2019 Dividend Policy
The following Dividend Policy shall be applicable:
- 2017: dividend, which will be distributed against 2017 Net Profit, will be equivalent to that of 2016 (€20Mn against 2016 Net Profit) increased by 10%.
- 2018: dividend, which will be distributed against 2018 Net Profit, will be equivalent to that of 2017, increased by 10%.
- 2019: dividend, which will be distributed against 2019 Net Profit, will be equivalent to that of 2018, increased by 10%.
The Cellnex tax contribution
Cellnex's taxation strategy establishes the fundamental guidelines governing the decisions and actions of the Cellnex Group in tax matters. Likewise, the company has established the control and management of tax risks rule, which defines the principles and structure of the control and management framework of these.
During 2018, the company sent out the control and management framework for tax risks to the appropriate areas whose functions and responsibilities make them particularly sensitive in the field of taxation. Likewise, to comply even more effectively with the rules on control and management of tax risks, the company began to implement a tool that makes it possible to perform recurrent monitoring of its tax situation and optimises the management of any risks that may be detected.
In 2019 this model has already begun to be implemented in Spain since it is the country where Cellnex headquarters is located. The implementation phase on other countries is scheduled in 2020, first among them Italy. The Control and Management Model for tax risks includes around 70 controls and all key elements, which allow us to know the degree of compliance in fiscal matters with regard of any area of the organisation whose activity could have tax impacts.
The Group acts responsibly in tax matters in its business management and meets its tax obligations in all the countries in which it operates - currently Spain, Italy, the Netherlands, Switzerland, France, the UK, Portugal and Ireland - applying consistent fiscal criteria in accordance with regulations, administrative doctrine and case law and maintaining appropriate relations with the corresponding tax authorities.
Cellnex is also sensitive to and aware of its responsibility in the economic development of the territories in which it operates, helping to create economic value by paying taxes, both on its own account and those collected from third parties. Accordingly, it makes a substantial effort and pays great attention to fulfilling its tax obligations, in accordance with the applicable rules in each territory.
In this sense, the company is working to adhere the Code of Good Tax Practice, where includes a series of recommendations aims to achieve the application of tax system, through cooperation between public Administration and companies.
Since the company wish to adhere to these proposed guidelines, in September of 2019, the Board of Directors agreed to adhere to the Code of Good Tax Practice and therefore, in 2020 the company will be initiate the necessary procedures to go ahead adherence.
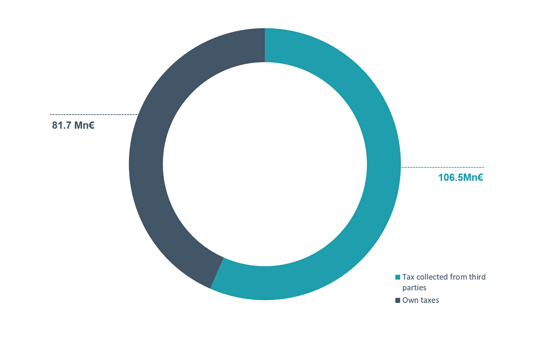
Following OECD methodology on cash basis accounting, Cellnex's total tax contribution in 2019 was € 169.1 million (160.5 in FY 2018). Own taxes are those paid for the company and third-party taxes are those collected and aid into the various tax offices on behalf of such third parties, therefore they are not a cost to the company.
CELLNEX’S TAX CONTRIBUTION IN 2019 (MN €)
|
31 December 2019 |
31 December 2018 |
||||
Own taxes(1) |
Tax collected from third parties (2) |
Total |
Own taxes(1) |
Tax collected from third parties (2) |
Total |
|
Spain |
25.5 |
64.2 |
89.7 |
24.1 |
68.1 |
92.2 |
Italy |
20.7 |
27.6 |
48.3 |
17.6 |
30.9 |
48.5 |
France |
1.6 |
1.9 |
3.5 |
0.3 |
0.8 |
1.1 |
Netherlands |
4.6 |
10.0 |
14.6 |
0.8 |
8.4 |
9.2 |
United Kingdom |
1.0 |
1.6 |
2.6 |
1.2 |
1.8 |
3.0 |
Switzerland |
9.2 |
1.3 |
10.5 |
3.7 |
2.8 |
6.5 |
Ireland |
- |
- |
- |
- |
- |
- |
Total |
81.7 |
106.6 |
169.1 |
47.7 |
112.8 |
160.5 |
(1) Includes taxes that are an effective cost to the company (basically includes payments of income tax, local taxes, miscellaneous taxes and employer's social security contributions).
(2) Includes taxes that do not affect the result but are collected by Cellnex on behalf of the tax administration or are paid in for third parties (basically includes net value added tax, deductions from employees and third parties, and employees’ Social Security contributions).
Income tax payment
The breakdown of the income tax payment by country for the 2019 financial year is as follows:
BREAKDOWN OF THE INCOME TAX PAYMENT BY COUNTRY
|
31 December 2019 |
31 December 2018 |
Spain |
1,567 |
1,601 |
Italy |
16,616 |
13,980 |
France |
- |
- |
Netherlands |
3,831 |
354 |
United Kingdom |
806 |
1,069 |
Switzerland |
2,100 |
3,220 |
Ireland |
- |
- |
Total |
24,920 |
20,224 |
Value generated and distributed
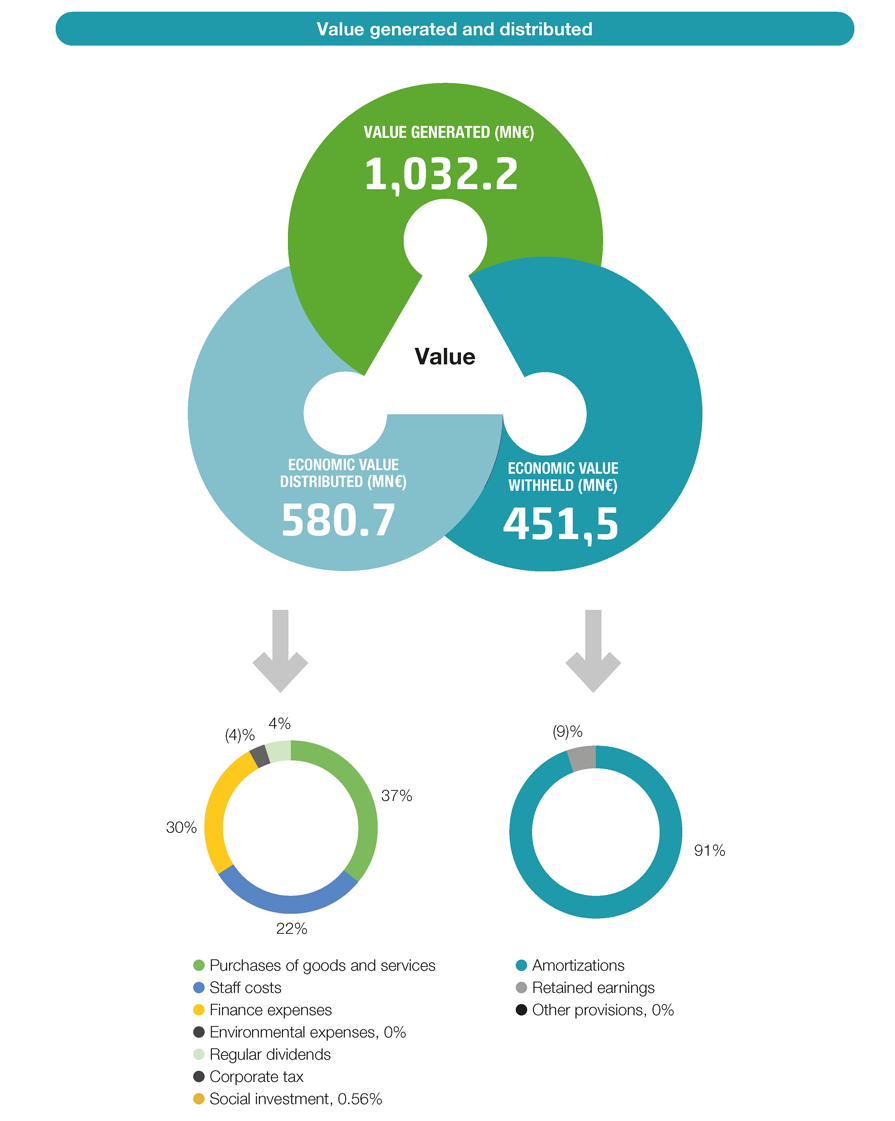
Value generated in 2019 by Cellnex was € 1,032 million (901 million FY 2018), distributed mainly to suppliers, employees, shareholders and public administration.
