Business performance and results
The year ended on 31 December 2018 highlights the strong alignment between the objectives set and the results achieved, given that the Group considers as a key element the integration of this growth into its management processes, ensuring that it can guarantee and deliver quality service to customers.
Alternative Performance Measures
An Alternative Performance Measure (APM) is a financial measure of historical or future financial performance, financial position, or cash flows, other than a financial measure defined or specified in the applicable financial reporting framework.
Cellnex believes that there are certain APMs, which are used by the Group’s Management in making financial, operational and planning decisions, which provide useful financial information that should be considered in addition to the financial statements prepared in accordance with the accounting regulations that apply (IFRS-EU), in assessing its performance. These APMs are consistent with the main indicators used by the community of analysts and investors in the capital markets.
In this sense, and in accordance with the provisions of the Guide issued by the European Securities and Markets Authority (ESMA), in force since 3 July, 2016, on the transparency of Alternative Performance Measures, Cellnex below provides information concerning those APMs it considers significant: Adjusted EBITDA; Adjusted EBITDA Margin; Gross and Net Financial Debt; Maintenance, Expansion and M&A CAPEX; and Recurring leveraged free cash flow.
The definition and determination of the aforementioned APMs are disclosed in the accompanying consolidated financial statements, and therefore, they are validated by the Group auditor (Deloitte).
Adjusted EBITDA
Relates to the “Operating profit” before “Depreciation and amortisation charge” (after IFRS 16 adoption) and after adding back (i) certain non-recurring items (such as cost related to acquisitions, contract renegotiation and redundancy provision) or (ii) certain non-cash items (such as advances to customers, prepaid expenses and LTIP remuneration payable in shares).
The Company uses Adjusted EBITDA as an operating performance indicator as it is considered a measure that best represents the cash generation of its business units and which is widely used as an evaluation metric among analysts, investors, rating agencies and other stakeholders. At the same time, it is important to highlight that Adjusted EBITDA is not a measure adopted in accounting standards and, therefore, should not be considered an alternative to cash flow as an indicator of liquidity. Adjusted EBITDA does not have a standardised meaning and, therefore, cannot be compared to the Adjusted EBITDA of other companies.
The criteria used to calculate the Adjusted EBITDA is different from the previous year due to the adoption of new accounting standards as detailed in Note 4 of these consolidated financial statements.
The Company presents comparative financial information from previous year as detailed in Note 2.e of these consolidated financial statements.
As at 31 December 2018 and 2017, respectively, the amounts are as follows:
Maintenance capital expenditures (Thousands of Euros)
| | 31 December 2018 | 31 December 2017
restated |
| Broadcasting infrastructure | 232,773 | 237,258 |
| Telecom Infrastructure Services | 582,758 | 471,585 |
| Other Network Services | 82,340 | 80,500 |
| Operating income | 897,871 | 789,343 |
| | | |
| Staff costs | (172,650) | (107,354) |
| Repairs and maintenance | (32,223) | (28,307) |
| Leases | (11,537) | (11,878) |
| Utilities | (72,312) | (74,073) |
| General and other services | (93,773) | (87,487) |
| Depreciation and amortisation charge | (402,846) | (351,682) |
| Operating profit | 112,530 | 128,562 |
| | | |
| Depreciation and amortisation | 402,846 | 351,682 |
| Non-recurring expenses | 72,067 | 17,014 |
| Advances to customers | 3,383 | 2,771 |
| Adjusted operating profit before depreciation and amortisation charge (Adjusted EBITDA) | 590,826 | 500,029 |
Non-recurring expenses and advances to customers are set out below (see in Note 19.d of the accompanying consolidated financial statements):
NON-RECURRING EXPENSES (THOUSANDS OF EUROS)
| | 31 December 2018 | 31 December 2017
restated |
| Costs related to acquisitions(1) | (13,607) | (10,877) |
| Contract renegotiation(2) | - | (3,825) |
| Prepaid expenses(3) | - | (2,312) |
| Advances to customers(4) | (3,383) | (2,771) |
| Redundancy provision(5) | (56,160) | - |
| LTIP remuneration payable in shares(6) | (2,300) | - |
| Total non-recurring expenses and advances to customers | (75,450) | (19,785) |
(1) Mainly includes expenses incurred during acquisition processes )non-recurring item).
(2) This relates to the cancellation expenses concerning the renegotiation of certain contracts with services providers. This renegotiations took place in order to achieve significant savings in costs over the coming years (non-recurring item).
(3) Prior to the adoption of IFRS 16 this item mainly included prepaid ground rental costs, prepaid energy and agency fees incurred to renegotiate rental contracts and which were taken to the consolidated income statement over the life of the corresponding ground lease contract (non-cash item).
(4) Includes the amortization of amounts paid for sites to be dismantled and their corresponding dismantling costs. These costs are treated as advances to customers in relation to the subsequent services agreement entered into with the customer (mobile telecommunications operators). These amounts are deferred over the life of the service contract with the operator as they are expected to generate future economic benefits in existing infrastructures (non-cash item).
(5) Mainly includes the amount recorded as at 31 December 2018 in accordance with the reorganisation plan detailed in Note 18.b of the accompanying consolidated financial statements.
(6) Corresponds to the LTIP remuneration accrued as of 31 December 2018, which is payable in Cellnex shares (See Note 18.b of the accompanying consolidated financial statements).
Adjusted EBITDA Margin
Corresponds to Adjusted EBITDA divided by total revenues excluding elements pass-through to customers (mostly electricity) from both expenses and revenues.
The criteria used to calculate the Adjusted EBITDA is different from the previous year due to the adoption of new accounting standards as detailed in Note 4 of these consolidated financial statements.
The Company presents comparative financial information from previous year as detailed in Note 2.e of these consolidated financial statements.
According to the above, the Adjusted EBITDA Margin as at 31 December 2018 and 2017 was 68% and 66%, respectively.
Gross financial debt
The Gross Financial Debt corresponds to “Bond issues and other loans”, “Loans and credit facilities” and “Lease liabilities”, but does not include any debt held by Group companies registered using the equity method of consolidation, “Derivative financial instruments” or “Other financial liabilities”.
The criteria used to calculate the Gross financial debt is different from the previous year due to the adoption of new standards as detailed in Note 4 of these consolidated financial statements.
The Company presents comparative financial information from previous year as detailed in Note 2.e of these consolidated financial statements.
According to the above, its value as at 31 December 2018 and 2017, respectively, is as follows:
Gross financial debt (Thousands of euros)
| | 31 December 2018 | 31 December 2017
restated |
| Bond issues and other loans (Note 14) | 2,510,176 | 1,898,619 |
| Loans and credit facilities (Note 14) | 585,561 | 633,189 |
| Lease liabilities (Note 15) | 526,337 | 425,982 |
| Gross financial debt | 3,622,074 | 2,957,790 |

Net financial debt
Relates to “Gross financial debt” minus “Cash and cash equivalents”.
Together with Gross Financial Debt, the Company uses Net Financial Debt as a measure of its solvency and liquidity as it indicates the current cash and equivalents in relation to its total debt liabilities. From the net financial debt, common used metrics are calculated such as the “Annualised Net Debt / Annualised Adjusted EBITDA” which is frequently used by analysts, investors and rating agencies as an indication of financial leverage.
The criteria used to calculate Net financial debt is different from the previous year due to the adoption of new standards as detailed in Note 4 of these consolidated financial statements.
The Company presents comparative financial information from previous year as detailed in Note 2.e of these consolidated financial statements.
The “Net financial debt” at 31 December 2018 and 2017 restated is detailed in Section 1.4. of the accompanying consolidated directors’ report for the period ended on 31 December 2018.
Capital expenditures
Maintenance capital expenditures
Corresponds to investments in existing tangible or intangible assets, such as investment in infrastructure, equipment and information technology systems, and are primarily linked to keeping sites in good working order, but which excludes investment in increasing the capacity of sites.
Expansion capital expenditures
Includes site adaptation for new tenants, ground leases (cash advances and land acquisitions), and efficiency measures associated with energy and connectivity, and early site adaptation to increase the capacity of sites. Thus, it corresponds to investments related to business expansion that generates additional adjusted EBITDA.
Expansion capital expenditures (Build to Suit programs)
Includes Build to Suit committed with different MNO’s like Bouygues Telecom and Sunrise, at the moment of the closing of the M&A projects or the corresponding new extensions.
M&A capital expenditures
Corresponds to investments in shareholdings of companies as well as significant investments in acquiring portfolios of sites (asset purchases).
The criteria used to calculate the Capital expenditures is the same as the previous year.
Total capital expenditure for the period ended 31 December 2018 and 2017, including property, plant and equipment, intangible assets, advance payments on ground leases and business combinations are summarised as follows:
Total investment (Thousands of euros)
| | 31 December 2018 | 31 December 2017 |
| Maintenance capital expenditures | 30,653 | 25,348 |
| Expansion capital expenditures | 93,764 | 88,136 |
| Expansion capital expenditures (Build to Suit programs) | 147,341 | 51,749 |
| M&A capital expenditures | 395,305 | 1,017,454 |
| Total investment | 667,063 | 1,182,687 |
Recurring leveraged free cash flow
The Company considers that the recurring leveraged free cash flow is one of the most important indicators of its ability to generate stable and growing cash flows which allows it to guarantee the creation of value, sustained over time, for its shareholders.
The criteria used to calculate the recurring leveraged free cash flow is different from the previous year due to the adoption of new standards as detailed in Note 4 of these consolidated financial statements.
The Company presents comparative financial information from previous year as detailed in Note 2.e of these consolidated financial statements.
At 31 December 2018 and 2017 the Recurring Leveraged Free Cash Flow (“RLFCF”) was calculated as follows:
Recurring leveraged free cash flow
| | 31 December 2018 | 31 December 2017
restated |
| Adjusted EBTIDA(1) | 590,826 | 500,029 |
| Payments of lease instalments in the ordinary course of business and interest payments(1) | (166,493) | (153,001) |
| Maintenance capital expenditures(3) | (30,653) | (25,348) |
| Changes in current assets/current liabilities(4) | 2,034 | 10,886 |
| Net payment of interest(5) | (64,503) | (40,941) |
| Income tax payment(6) | (20,219) | (13,349) |
| Net dividends to non-controlling interests(7) | (6,274) | (631) |
| Recurring leveraged free cash flow (RLFCF) | 304,718 | 277,645 |
| | | |
| Expansion Capex(8) | (93,764) | (88,136) |
| Expansion Capex (Build to Suit programs)(9) | (147,341) | (51,749) |
| M&A Capex (cash only)(10) | (392,125) | (829,961) |
| Non-Recurrent Items (cash only)(11) | (45,048) | (14,702) |
| Net Cash Flow from Financing Activities(12) | 553,370 | 807,280 |
| Other Net Cash Out Flows(13) | (19,113) | 1,945 |
| Net Increase of Cash(14) | 160,697 | 102,322 |
(1) Adjusted EBITDA: Profit from operations before D&A (after IFRS 16 adoption) and after adding back (i) certain non-recurring items (such as cost related to acquisitions (€14Mn), and redundancy provisions (€56Mn)) or (ii) certain non-cash items (such as LTIP remuneration payable in shares (€2Mn) and advances to customers (€3Mn) which include the amortisation of amounts paid for sites to be dismantled and their corresponding dismantling costs).
(2) Corresponds to payments of lease instalments in the ordinary course of business (€112Mn) and interest payments on lease liabilities (€54Mn). See Note 15 of the accompanying Consolidated Financial Statements.
(3) Maintenance capital expenditures: investment in existing tangible or intangible assets, such as investment in infrastructure, equipment and information technology systems, and are primarily linked to keeping sites in good working order, but which excludes investment in increasing the capacity of sites.
(4) Changes in current assets/current liabilities (see the relevant section in the Consolidated Statement of Cash Flows for the period ended 31 December 2018), following the same methodology used in 2017.
(5) Net payment of interest corresponds to the net of “Interest paid” and “interest received” in the accompanying Consolidated Statement of Cash Flows for the period ended 31 December 2018), following the same methodology used in 2017. The amount corresponds to net interest payments (€65Mn), which do not include “Interest payments on lease liabilities” (€54Mn) (see Note 15 of the accompanying consolidated financial statements).
(6) Income tax payment (see the relevant section in the accompanying Consolidated Statement of Cash Flows for the period ended 31 December 2018), following the same methodology used in 2017.
(7) Corresponds to the net of “Dividends to non-controlling interests” and “Dividends received” in the accompanying Consolidated Statement of Cash Flows for the period ended 31 December 2018, following the same methodology used in 2017.
(8) Expansion capital expenditures: Ground leases (€52Mn), efficiency measures associated with energy and connectivity (€9Mn), and others (including early site adaptation to increase the capacity of sites), following the same methodology used in 2017. Ground leases includes €40Mn relating to “cash advances to landlords” (See Note 15 of the accompanying Consolidated Financial Statements), with the balance corresponding to land acquisitions. Thus, it corresponds to investments related to business expansion that generates additional adjusted EBITDA.
(9) Build to Suit committed with Bouygues Telecom and Sunrise, at the moment of the closing of the M&A project or the corresponding new extensions; following the same methodology used in 2017.
(10) M&A capital expenditures (cash only): Investments in shareholdings of companies as well as significant investments in acquiring portfolios of sites (asset purchases), after integrating into the consolidated balance sheet mainly the “Cash and cash equivalents” of the acquired companies and the contribution of minority shareholders. The amount resulting from: (3)+(8)+(9)+(10) corresponds to “Total Investment” (see caption “Capital Expenditures” in the accompanying Consolidated Financial Statements for the period ended 31 December 2018), minus the “Cash and cash equivalents” of the acquired companies (€-3Mn) and; also corresponds to “Total net cash flow from investing activities” (see the relevant section in the accompanying Consolidated Statement of Cash Flows for the period ended 31 December 2018), after adding the Cash advances to landlords (€-40Mn) and others (€+1Mn), following the same methodology used in 2017.
(11) Consists of “non-recurring expenses and advances to customers” that have involved cash movements, which correspond to “Costs related to acquisitions” and “Redundancy provisions”.
(12) Corresponds to “Total net cash flow from financing activities”, which do not include “Net payment of lease liabilities”, “Dividends to non-controlling interests” and “Dividends received” (see the relevant section in the Consolidated Statement of Cash Flows for the period ended 31 December 2018), following the same methodology used in 2017.
(13) Mainly corresponds to “Foreign exchange differences” (see the relevant section in the Consolidated Statement of Cash Flows for the period ended 31 December 2018), payment related to the Long Term Incentive Plan (2015-2017) (see Note 18.b of the accompanying Consolidated Financial Statements) and other items, following the same methodology used in 2017.
(14) “Net (decrease)/increase in cash and cash equivalents from continuing operations” (see the relevant section in the Consolidated Statement of Cash Flow for the period ended 31 December 2018), following the same methodology used in 2017.
Revenues and Results
Income from operations for the year ended on 31 December 2018 reached EUR 898 million, which represents a 14% increase over the same period in 2017. This increase was mainly due to the expansion of the above-mentioned telecom infrastructure services for mobile network operators.
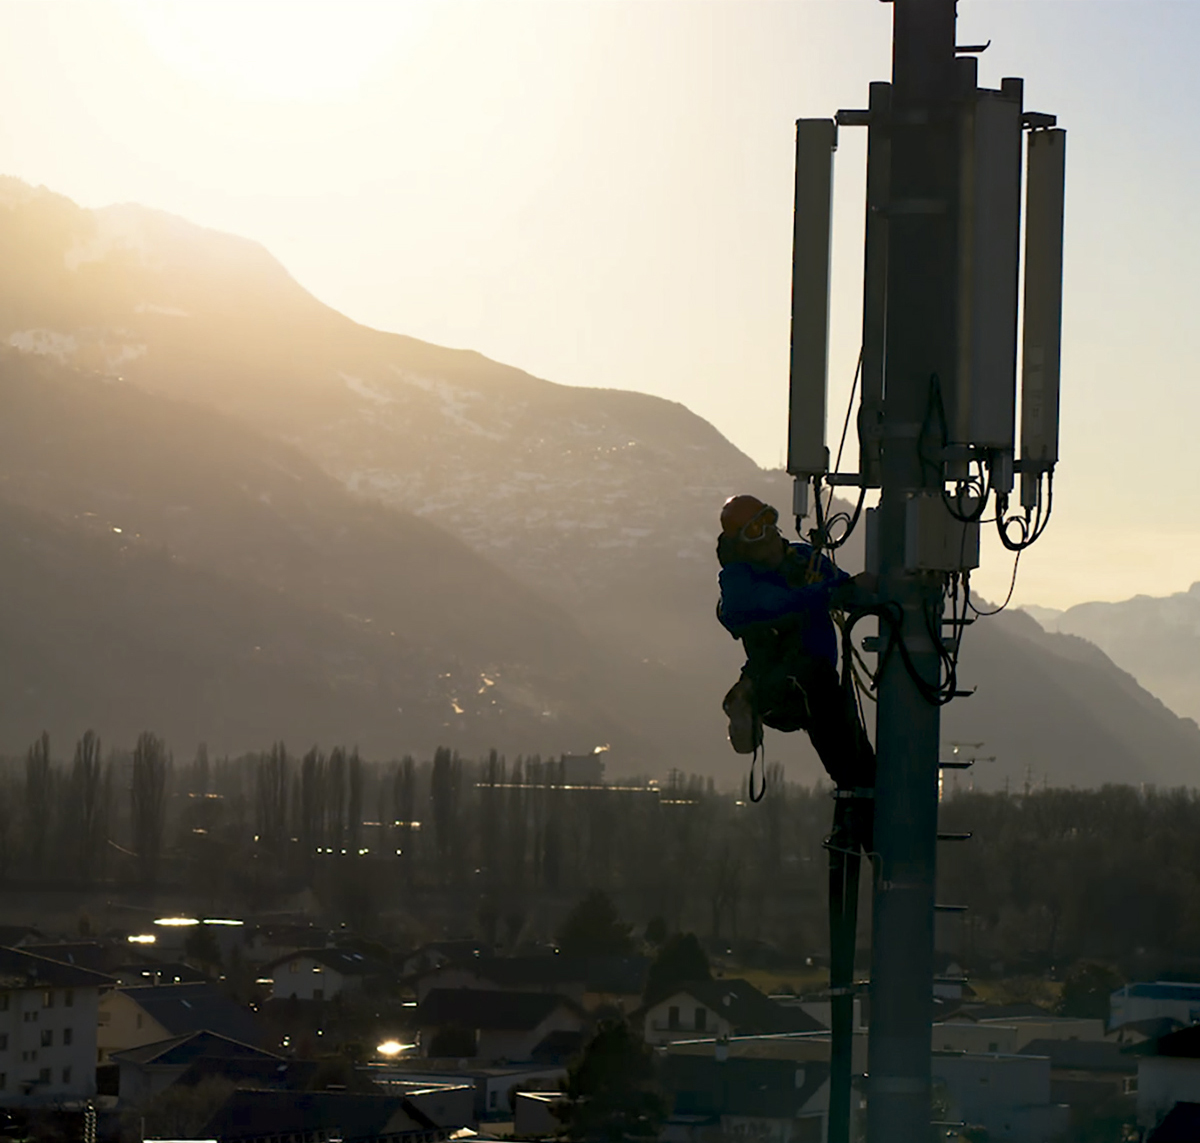
Telecom Infrastructure Services’ income increased by 24% to EUR 583 million due to the acquisitions performed during the second half of 2017 and 2018. This business segment is characterised by solid growth driven by increasing demand for wireless data communication services, and by the growing interest of mobile network operators (MNOs) in developing high quality networks that fulfil their consumers’ needs in terms of uninterrupted coverage and availability of wireless bandwidth (based on new Long-Term Evolution “LTE” technologies), in the most efficient way. In recent years the Group consolidated its infrastructure network and long-term strategic relationships with its main customers, the mobile network operators. In addition to its current portfolio Group’s Management has identified several potential acquisitions which are currently being analysed following its demanding capital deployment criteria. The Group owns a high-quality asset portfolio which is made up of selective assets in Spain, Italy, the Netherlands, France, the United Kingdom and Switzerland and performs the subsequent streamlining and optimisation of the tower infrastructure for Telecom Infrastructure Services. Its main added value proposals in this line of business consist of providing services to additional mobile network operators in its towers and therefore streamlining the customer’s network. By increasing the ratio of customers to infrastructures, the Group will generate additional income with very little additional costs. This network streamlining may generate significant efficiencies for the Group and for the MNOs.
With regard to the Broadcasting Infrastructure business, income amounted to EUR 233 million which represents a 2% decrease compared with the same period in 2017.
Broadcasting Infrastructure activities are characterised by predictable, recurring and stable cash flows. Although this is a mature business in Spain, broadcasting activities have shown considerable resilience to adverse economic conditions, such as those experienced in Spain in recent years, this is due to the fact that the Group’s income does not depend directly on macroeconomic factors, but rather on the demand for radio and television broadcasting services by broadcasting companies.
Other Network Services increased its income by 2%, to EUR 82 million. This constitutes a specialised business that generates stable cash flows with attractive potential for growth. Taking into account the critical nature of the services in which the Group collaborates, its customers require in-depth technical know-how that is reflected in the demanding service level agreements. The Group considers that it has a privileged market presence and geographical distribution, established relationships with government agencies and excellent infrastructure for emergencies and public services. The Group’s aim is to maintain long-term relationships with its customers maximise the renewal rate of its contracts and expand its business through new contracts. In relation to this business segment, during 2018, Cellnex incorporated the XOC, a concessionary company dedicated to the management, maintenance and construction of the fiber optic network of the Generalitat de Catalunya.

All of the above has helped boost operating income and operating profit, with the latter also being impacted by the measures to improve efficiency and optimise operating costs.
In line with the increase in revenue, Adjusted EBITDA was 18% higher than 2017, as a result of the business combinations and assets acquired during the second half of 2017, and during 2018 as well as organic growth which reflects the Group’s capacity to generate cash flows on a continuous basis.
Operating profit decreased by 13% compared with 2017 mainly due to the reorganisation plan agreed during the first quarter of 2018 in order to adjust the workforce in its Spanish subsidiaries Tradia and Retevisión, which manage the terrestrial television infrastructure network (as detailed in Note 18.b) of the accompanying consolidated financial statements).
Taking into account these considerations, the consolidated loss attributable to shareholders on 31 December 2018 stood at EUR 15 million.

 Consolidated Balance Sheet
Total assets at 31 December 2018 stood at EUR 5,133 million, a 15% increase compared with the year-end December 2017, as a result of the asset purchases made during the 2018 in France, Switzerland and Spain. Around 63% of total assets relates to property, plant and equipment and other intangible assets, in line with the nature of the Group’s business related to the management of terrestrial telecommunications infrastructure. The increase in property, plant and equipment is a result of the above-mentioned acquisitions.
Consolidated net equity amounted to EUR 613 million, in line with 2017 year-end closing. The main impacts during 2018 relates to the consolidated net loss of the year, the final dividend distributed, the acquisition of treasury shares, and the convertible bond issued in January 2018 (as detailed in Note 14 of the accompanying consolidated financial statements).
Consolidated cash flow generation
Net Payment of Interest
The reconciliation of the caption “Net payment of interest” from the consolidated cash flow statement corresponding to the period ended on 31 December 2018 and 2017, with the “net interest expense” in the financial statements is as follows.
| (Thousands of Euros) | 31 December 2018 | 31 December 2017
restated |
| Interest Income (Note 19.g) | 3,461 | 1,397 |
| Interest Expense (Note 19.g) | (152,285) | (110,474) |
| Bond & loan interest accrued not paid | 44,582 | 35,722 |
| Put Options – non-cash | 5,676 | 5,365 |
| Amortised costs – non-cash | 15,147 | 2,119 |
| Interest accrued in prior year paid in current year | (35,538) | (15,987) |
| Net payment of interest as per the Consolidated Statement of Cashflows | (118,957) | (81,858) |
Income Tax Payment
The reconciliation between the payment of income tax according to the consolidated statement of cashflows and the current income tax expense for 2018 and 2017 is as follows:
| (Thousands of Euros) | 31 December 2018 | 31 December 2017
restated |
| Current tax expense (Note 17.c) | (18,290) | (20,273) |
| Payment of income tax prior year | (5,975) | (1,303) |
| Receivable of income tax prior year | 1,318 | 458 |
| Income tax (receivable)/payable | 5,739 | 7,289 |
| Others | (3,011) | 481 |
| Payment of income tax as per the Consolidated Statement of Cashflows | (20,219) | (13,349) |
GRI: 102-7, 203-1