Liquidity and Capital Resources
Net financial debt
The “Net financial debt” at 31 December 2018 and 2017 is as follows:
NET FINANCIAL DEBT (THOUSANDS OF EUROS)
| | 31 December 2018 | 31 December 2017
restated |
| Gross financial debt (1) | 3,622,074 | 2,957,790 |
| Cash and cash equivalents (Note 12) | (455,870) | (295,173) |
| Net financial debt | 3,166,204 | 2,662,617 |
(1) As defined in Section “Business performance and results” of the accompanying consolidated management report corresponding to the year ended on 31 December 2018.
At 31 December 2018, the net bank financial debt amounted to EUR 3,166 million (EUR 2,663 million in 2017), including a consolidated cash and cash equivalents position of EUR 456 million (EUR 295 million in 2017). The ratio of net financial debt to Adjusted annualised EBITDA amounts to 4.9x(29) (4.6x in 2017 restated).
(29) The ratio is calculated as 12-month forward-looking Adjusted EBITDA (see outlook 2019), divided by net debt 2018.
NET FINANCIAL DEBT EVOLUTION
Net Debt Evolution (including accrued interest)
(Thousands of Euros) | 31 December 2018 | 31 December 2017
restated |
| Beginning of Period | 2,662,617 | 1,844,573 |
| Recurring leveraged free cash flow | (304,718) | (277,645) |
| Expansion Capex | 93,764 | 88,136 |
| Expansion Capex (Build to Suit programs) | 147,341 | 51,749 |
| M&A Capex (cash only) | 392,125 | 829,961 |
| Non-Recurrent Items (cash only) | 45,048 | 14,702 |
| Other Net Cash Out Flows | 19,113 | (1,945) |
| Payment of Dividends (1) | 24,211 | 20,000 |
| Treasury Stock (2) | 5,035 | (1,587) |
| Equity associated with the issuance of convertible bond | (62,480) | - |
| Net repayment of other borrowings (3) | 11,220 | 1,188 |
| Change in Lease Liabilities (4) | 100,355 | 80,863 |
| Accrued Interest Not Paid and Others (non-cash) | 32,573 | 12,622 |
| End of Period | 3,166,204 | 2,662,617 |
(1) “Dividends paid” (see the relevant section in the Consolidated Statement of Cash Flows for the period ended 31 December 2018), following the same methodology used in 2017.
(2). “Acquisition of treasury shares” (see the relevant section in the Consolidated Statement of Cash Flows for the period ended 31 December 2018), following the same methodology used in 2017.
(3). “Net repayment of other borrowings” (see the relevant section in the Consolidated Statement of Cash Flows for the period ended 31 December 2018), following the same methodology used in 2017.
(4). Changes in “Lease liabilities” long and short term of the accompanying Consolidated Balance Sheet as of 31 December 2018. See Note 15 of the accompanying Consolidated Financial Statements.
Liquidity availability
The breakdown of the available liquidity at 31 December 2018 and 2017 is as follows:
| | 31 December 2018 | 31 December 2017
restated |
| Available in credit facilities (Note 14) | 1,019,927 | 1,060,070 |
| Cash and cash equivalents (Note 12) | 455,870 | 295,173 |
| Available liquidity | 1,475,797 | 1,355,243 |
As at 31 December 2018, Cellnex weighted average cost of debt (considering both the drawn and undrawn borrowings) was 1.9% (2.0% as at 31 December 2017)
Regarding the Corporate Rating, at 31 December 2018, Cellnex holds a long term “BBB-“ (investment grade) with negative outlook according to the international credit rating agency Fitch Ratings Ltd. and a long-term “BB+” with stable outlook according to the international credit rating agency Standard & Poor’s Financial Services LLC.
Shareholder remuneration
On 31 May 2018, the Annual Shareholders’ Meeting approved the distribution of a dividend charged to the share premium reserve to a maximum of EUR 63 million, payable in one or more instalments during the years 2018, 2019 and 2020. It was also agreed to delegate to the Board of Directors the authority to establish, if this is the case, the amount and the exact date of each payment during said period, always attending to the maximum overall amount stipulated.
During 2018, in compliance with the Company´s dividend policy, the Board of Directors, pursuant to the authority granted by resolution of the Annual Shareholders’ Meeting of 31 May 2018, approved the distribution of a dividend charged to the share premium reserve in the amount of EUR 11,816 thousand, which represented EUR 0.0510 per share. In addition, on 8 November 2018, the Board of Directors, approved the distribution of a dividend charged to the share premium reserve in the amount of EUR 12,395 thousand, which represented EUR 0.0535 per share.
Thus, the total dividend distributed for share premium reserve was EUR 0.1045 gross per share, which represents EUR 24,211 thousand.
Along with the final cash dividend of EUR 12 million to be paid in 2019 (pursuant to the corresponding approval by AGM), the total cash dividend distribution against 2018 results or reserves will have increased by 10% in relation to the dividend distributed against 2017 results or reserves.
2017-2019 Dividend Policy
The following Dividend Policy shall be applicable:
- �2017: dividend, which will be distributed against 2017 Net Profit, will be equivalent to that of 2016 (€20Mn against 2016 Net Profit) increased by 10%.
- 2018: dividend, which will be distributed against 2018 Net Profit, will be equivalent to that of 2017, increased by 10%.
- �2019: dividend, which will be distributed against 2019 Net Profit, will be equivalent to that of 2018, increased by 10%.
The payment of the dividends will be made on the specific dates to be determined in each case and will be duly announced.
Notwithstanding the above, the Company’s ability to distribute dividends depends on a number of circumstances and factors including, but not limited to, net profit attributable to the Company, any limitations included in financing agreements and Company’s growth strategy. As a result, such circumstances and factors may modify this Dividend Policy. In any case, any future amendment on this policy will be duly announced.
This Dividend Policy aims at keeping the appropriate balance between, shareholder remuneration, Company’s profit generation and Company’s growth strategy, ensuring an adequate capital structure.
The Cellnex tax contribution
Cellnex’s taxation strategy establishes the fundamental guidelines governing the decisions and actions of the Cellnex Group in tax matters. Likewise, the company has established the control and management of tax risks rule, which defines the principles and structure of the control and management framework of these.
During this financial year, the company has sent out the control and management framework for tax risks to the appropriate areas whose functions and responsibilities make them particularly sensitive in the field of taxation. Likewise, to comply even more effectively with the rules on control and management of tax risks, the company has begun to implement a tool that makes it possible to perform recurrent monitoring of its tax situation in Spain and optimises the management of any risks that may be detected. Cellnex plans to push this forward in Spain at the beginning of 2019 and to start implementing this tool in the remaining jurisdictions in the middle of the year.
The Group acts responsibly in tax matters in its business management and meets its tax obligations in all the countries in which it operates - currently Spain, Italy, the Netherlands, Switzerland France and the UK - applying consistent fiscal criteria in accordance with regulations, administrative doctrine and case law and maintaining appropriate relations with the corresponding tax authorities.
Cellnex is also sensitive to and aware of its responsibility in the economic development of the territories in which it operates, helping to create economic value by paying taxes, both on its own account and those collected from third parties. Accordingly, it makes a substantial effort and pays great attention to fulfilling its tax obligations, in accordance with the applicable rules in each territory.
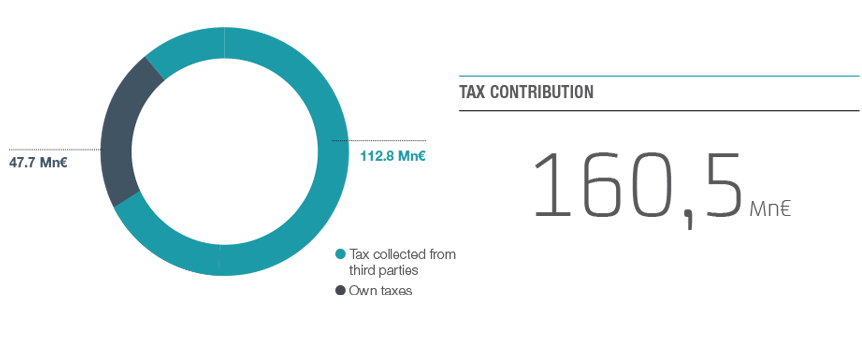
Following OECD methodology on cash basis accounting, Cellnex’s total tax contribution in 2018 was € 160.5 million (167.6 in FY 2017). Own taxes are those paid for the company and third-party taxes are those collected and aid into the various tax offices on behalf of such third parties, therefore they are not a cost to the company.
Cellnex’s tax contribution in 2018 (Mn €)
| Region | Own taxes (Mn)(1) | Tax collected from third parties (Mn)(2) | Total (Mn) |
| Spain | 24.1 | 68.1 | 92.2 |
| Italy | 17.6 | 30.9 | 48.5 |
| France | 0.3 | 0.8 | 1.1 |
| Netherlands | 0.8 | 8.4 | 9.2 |
| United Kingdom | 1.2 | 1.8 | 3.0 |
| Switzerland | 3.7 | 2.8 | 6.5 |
| Total | 47.7 | 112.8 | 160.5 |
(1) Includes taxes that are an effective cost to the company (basically includes payments of income tax, local taxes, miscellaneous taxes and employer’s social security contributions).
(2) (Includes taxes that do not affect the result but are collected by Cellnex on behalf of the tax administration or are paid in for third parties (basically includes net value added tax, deductions from employees and third parties, and employees’ Social Security contributions).
Income tax payment
The breakdown of the income tax payment by country for the 2018 financial year is as follows:
Breakdown of the income tax payment by country
| Region | Income tax payment (in Thousands Euros) |
| Spain | 1,601 |
| Italy | 13,980 |
| France | - |
| Netherlands | 354 |
| United Kingdom | 1,069 |
| Switzerland | 3,220 |
| Total | 20,224 |
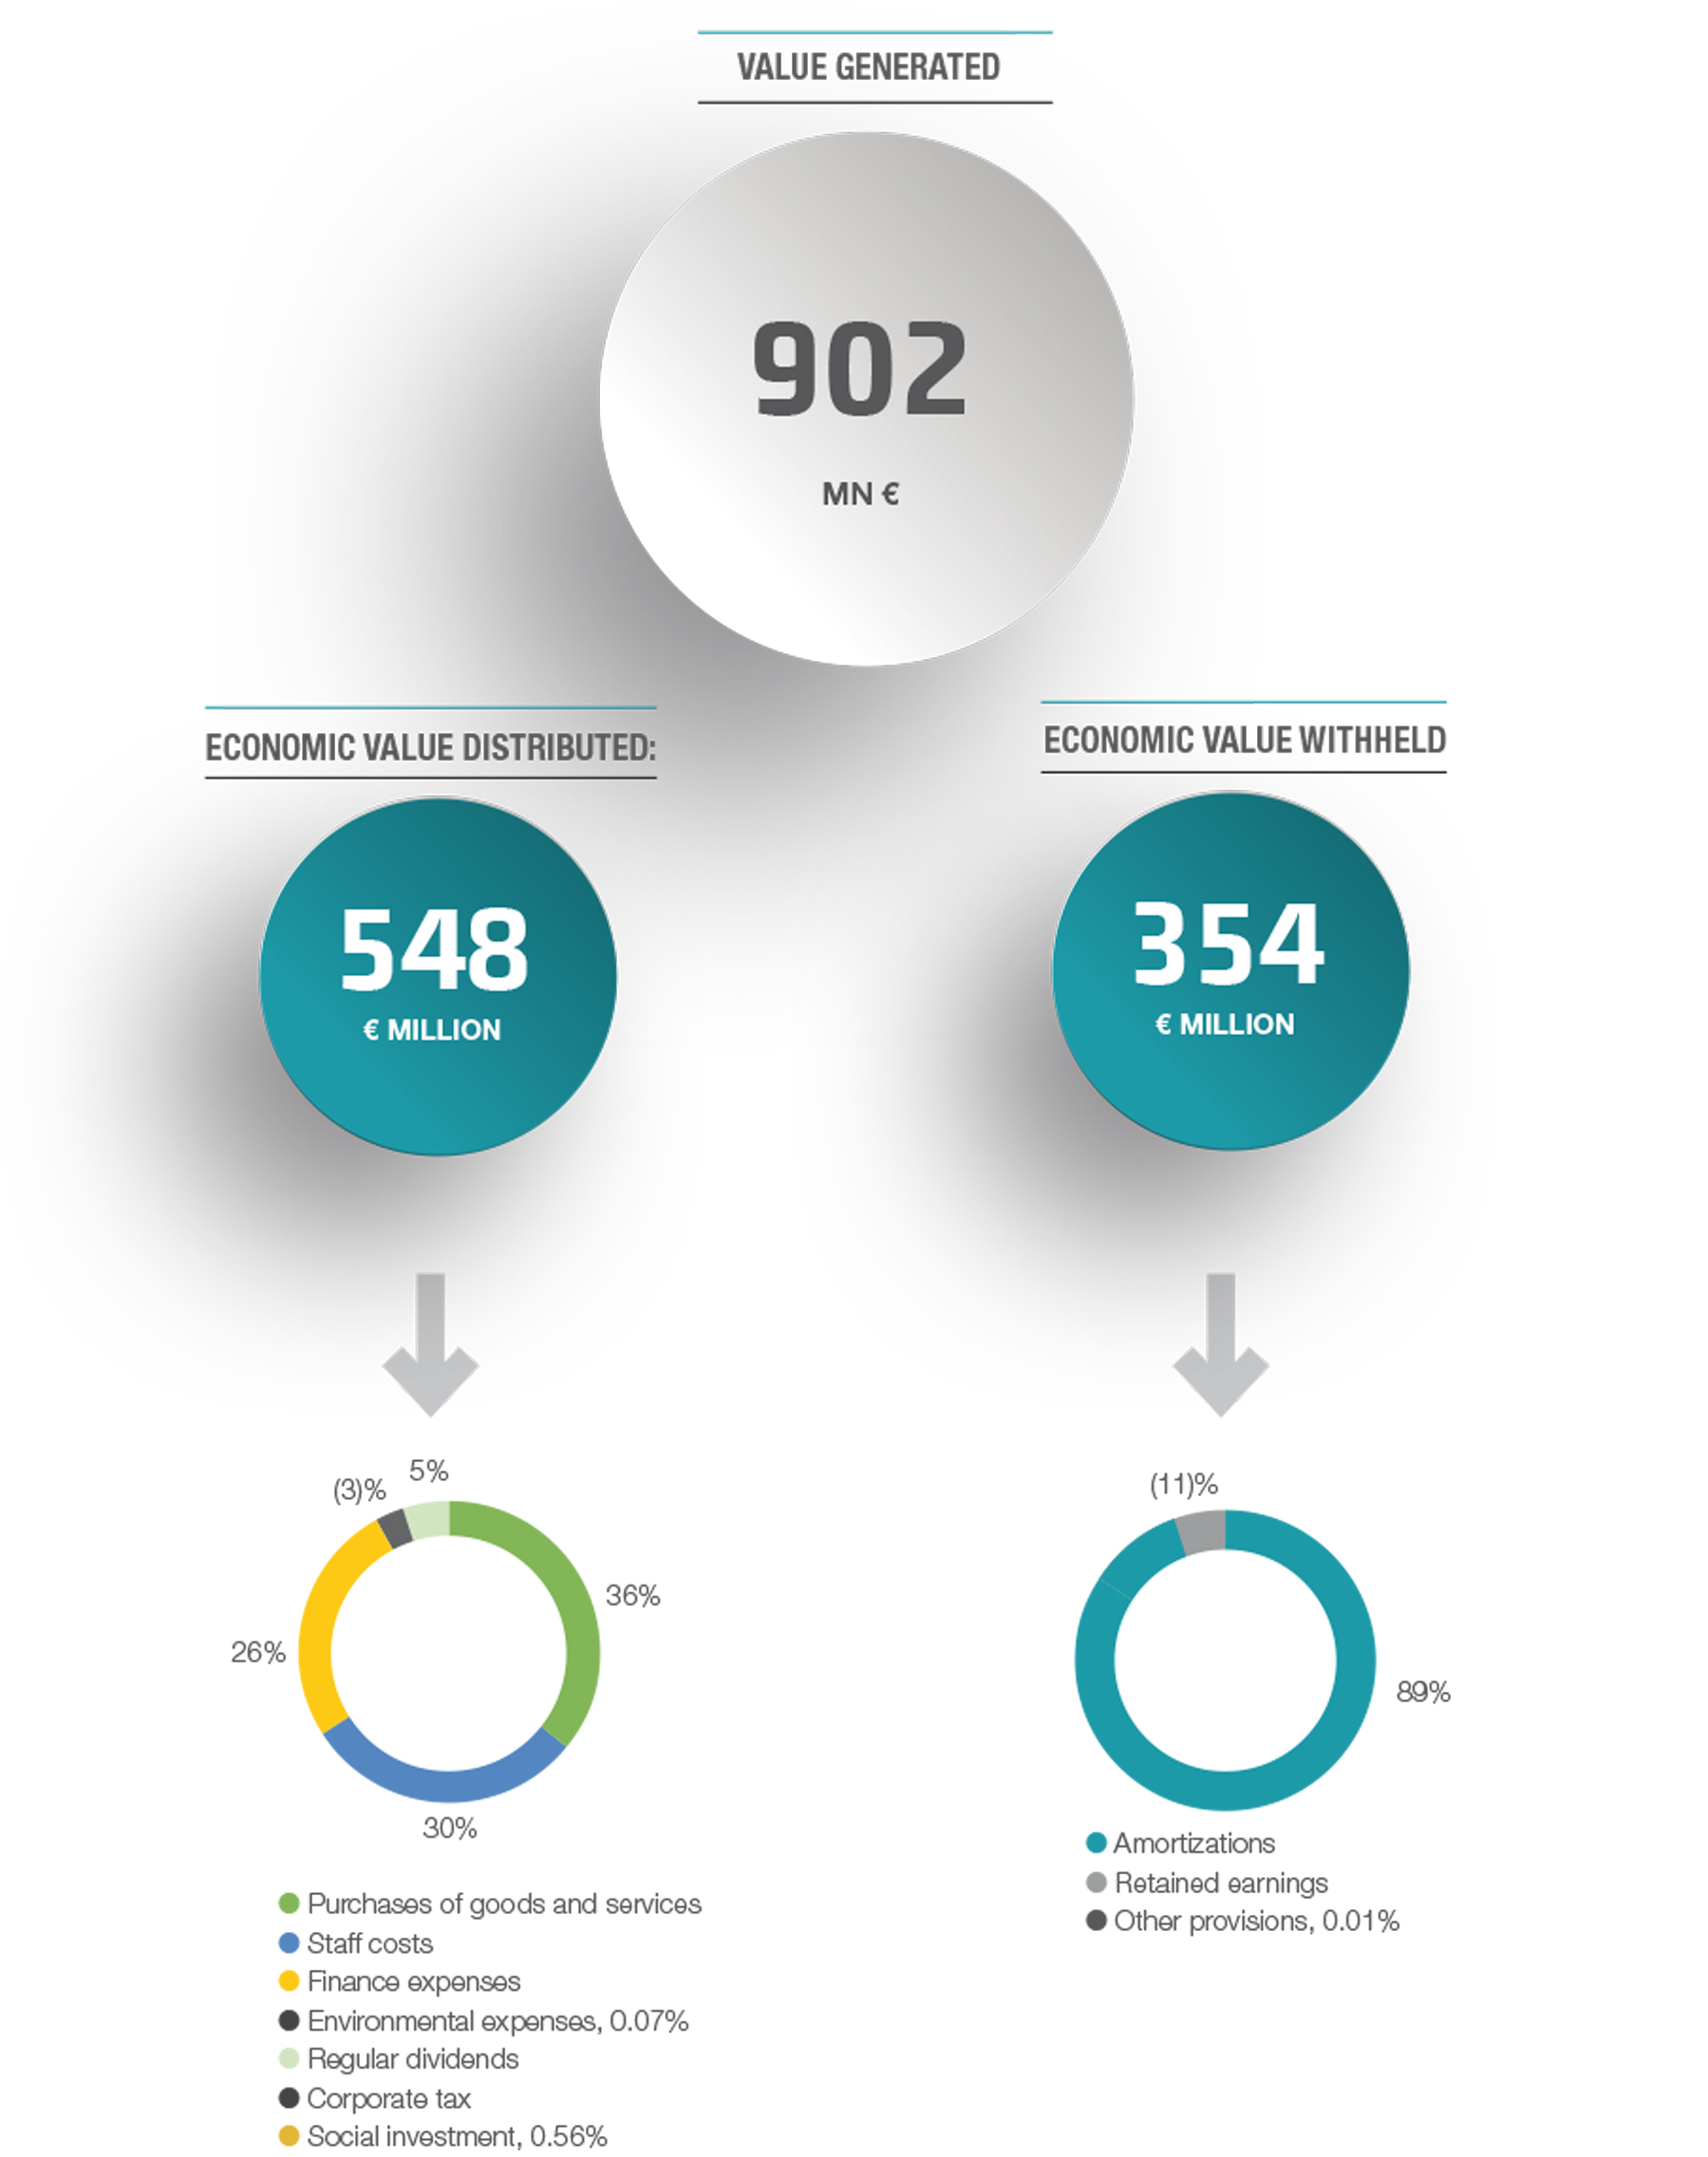
Value generated and distributed
Value generated in 2018 by Cellnex was € 902 million, distributed mainly to suppliers, employees, shareholders and public administration.
GRI: 102-7, 201-1