Financial and operating figures
The year ended on 31 December 2017 highlights the strong alignment between the objectives set and the results achieved, given that the Group considers as a key element the integration of this growth into its management processes, ensuring that it can guarantee and deliver quality service to customers.
Cellnex believes that certain Alternative Performance Measures (APMs) provide financial information in addition to that obtained from the applicable accounting standards (EU-IFRSs) that are useful for assessing the performance of the Group and which are used by management in its decision-making processes. In this regard, in accordance with the recommendations issued by the European Securities and Markets Authority (ESMA), the definition and determination of the main APMs employed are disclosed in the accompanying consolidated financial statements, and therefore, they are validated by the Group auditor (Deloitte).
| Adjusted EBITDA (Thousands of Euros) |
|
| 31 December 2017 | 31 December 2016 |
| Broadcasting infrastructure | 237,258 | 235,234 |
| Telecom Infrastructure Services | 471,585 | 382,539 |
| Other Network Services | 80,500 | 86,812 |
| Operating income | 789,343 | 704,585 |
| | | |
| Staff costs | (107,354) | (97,471) |
| Repairs and maintenance | (28,307) | (26,522) |
| Leases | (146,170) | (127,490) |
| Utilities | (74,073) | (72,604) |
| General and other services | (109,631) | (116,990) |
| Depreciation and amortisation charge | (225,382) | (176,779) |
| Operating profit | 98,426 | 86,729 |
| | | |
| Depreciation and amortisation | 225,382 | 176,779 |
| Non-recurring expenses (1) | 27,959 | 23,458 |
| Advances to customers | 2,771 | 2,590 |
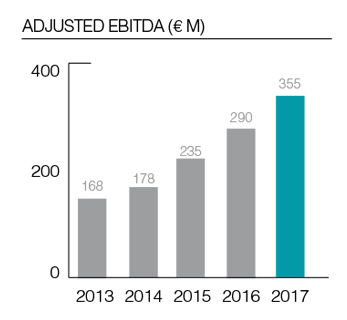
| Adjusted operating profit before depreciation and amortisation charge (Adjusted EBITDA (2)) | 354,538 | 289,556 |
(1) Non-recurring expenses mainly include expenses related to inorganic growth projects, tax associated with acquisitions, together with the amortization of advances to customer and prepaid expenses (impact on the 2017 income statement, without cash effect).
(2) Adjusted EBITDA: Profit from operations before D&A and after adding back (i) certain non-recurring items (such as cost related to acquisitions and contract renegotiation) or (ii) certain non-cash items (such as advances to customers and prepaid expenses). |
Non-recurring expenses are set out below (see in Note 17.c of the accompanying consolidated financial statements):
| Non-recurring expenses |
|
| 31 December 2017 | 31 December 2016 |
| Costs related to acquisitions (1) | 10,877 | 9,736 |
| Contract renegotiation (2) | 3,825 | 5,631 |
| Prepaid expenses (3) | 13,257 | 8,091 |
| Advances to customers (4) | 2,771 | 2,590 |
| Total non-recurring expenses and advances to customers | 30,730 | 26,048 |
(1) It mainly includes the expenses incurred during the acquisition processes, relating to M&A activities (non-recurring item).
(2) It relates to the cancellation expenses concerning the renegotiation of some contracts with services providers. This renegotiations took place in order to achieve significant savings in costs over the coming years (non-recurring item).
(3) It mainly includes prepaid ground rental costs amounting to EUR 10,929 thousand (EUR 3,766 thousand in 2016), prepaid energy and agency fees incurred to renegotiate rental contracts for an amount of EUR 2,328 thousand (EUR 4,325 thousand in 2016), and which are taken to the consolidated income statement over the life of the corresponding ground lease contract (non-cash item).
(4) It includes the amortization of amounts paid for sites to be dismantled and their corresponding dismantling costs, which are treated as advances to customers in relation to the subsequent services agreement entered into with the customer (mobile telecommunications operators). These amounts are deferred over the life of the service contract with the operator as they are expected to generate future economic benefits in existing infrastructures (non-cash item). |
Consolidated Cash Flow Generation
The ability of the Group to generate stable and growing cash flows allows it to guarantee the creation of value, sustained over time, for its shareholders. At 31 December 2017 and 2016 the Recurring Leveraged Free Cash Flow (“RLFCF”) was calculated as follows.
| Consolidated Cash Flow Generation (Thousands of Euros) |
|
| 31 December 2017 | 31 December 2016 |
| Adjusted EBTIDA(1) | 354,538 | 289,556 |
| Maintenance capital expenditures(2) | (25348) | (21423) |
| Changes in current assets/current liabilities(3) | 3376 | 17931 |
| Net payment of interest(4) | (40941) | (23208) |
| Income tax payment(5) | (13349) | (11477) |
| Net dividends to non-controlling interests(6) | (631) | - |
| Recurring leveraged free cash flow | 277645 | 251379 |
| | | |
| Expansion Capex(7) | (88136) | (57307) |
| Expansion Capex (Build to Suit programs) (8) | (51749) | - |
| M&A Capex (cash only) (9) | (829961) | (669683) |
| Non-Recurrent Items (cash only)(10) | (14702) | (9736) |
| Net Cash Flow from Financing Activities(11) | 807280 | 659322 |
| Other Net Cash Out Flows (12) | 1945 | (32124) |
| Net Increase of Cash (13) | 102322 | 141851 |
(1) Adjusted EBITDA: Profit from operations before D&A and after adding back (i) certain non-recurring items (such as cost related to acquisitions (€11Mn) and contract renegotiation (€4Mn)) or (ii) certain non-cash items (such as advances to customers (€3Mn) and prepaid expenses (€13Mn)).
(2) Maintenance capital expenditures: investment in existing tangible or intangible assets, such as investment in infrastructure, equipment and information technology systems, and are primarily linked to keeping sites in good working order, but which excludes investment in increasing the capacity of sites.
(3) Changes in current assets/current liabilities (see the relevant section in the Consolidated Statement of Cash Flows Statement for the year ended 31 December 2017), following the same methodology used in 2016.
(4) Net payment of interest corresponds to the net of “Interest paid” and “Interest received” in the accompanying Consolidated Cash Flows Statement for the year ended 31 December 2017, following the same methodology used in 2016.
(5) Income tax payment (see the relevant section in the accompanying Consolidated Cash Flows Statement for the year ended 31 December 2017), following the same methodology used in 2016.
(6) Corresponds to the net of “Dividends to non-controlling interests” and “Dividends received” in the accompanying Consolidated Cash Flows Statement for the year ended 31 December 2017, following the same methodology used in 2016.
(7) Expansion capital expenditures: Site adaptation for new tenants (€37Mn) + Ground leases (cash advances and land acquisitions €42Mn) + Other efficiency measures associated with energy and connectivity (€9Mn). Following the same methodology used in 2016.
(8) Build to Suit committed with Bouygues (€45Mn) and Sunrise (€7Mn), at the closing of the M&A projects.
(9) M&A capital expenditures (cash only): Investments in shareholdings of companies as well as significant investments in acquiring portfolios of sites (asset purchases), after integrating into the consolidated balance sheet mainly the "Cash and cash equivalents" of the acquired companies and the contribution of minority shareholders.
The amount resulting from: (2)+(7)+(8)+(9) corresponds to “Total Investment” (see caption “Consolidated Balance Sheet and Capital Expenditure” in the accompanying Annual Integrated Report for the year ended 31 December 2017) and; also mainly corresponds to “Total net cash flow from investing activities” (see the relevant section in the accompanying Consolidated Cash Flows Statement for the year ended 31 December 2017), following the same methodology used in 2016.
(10) It consists of "non-recurring expenses and advances paid to customers" that have involved cash movements, which correspond to "Costs related to acquisitions" (11Mn) and "Contract renegotiations" (€4Mn).
(11) Mainly corresponds to “Total net cash flow from financing activities” (see the relevant section in the Consolidated Statement of Cash Flows Statement for the year ended 31 December 2017), following the same methodology used in 2016.
(12) “Foreign exchange differences” (see the relevant section in the Consolidated Statement of Cash Flows Statement for the year ended 31 December 2017), and other items, following the same methodology used in 2016.
(13) “Net (decrease)/increase in cash and cash equivalents from continuing operations” (see the relevant section in the Consolidated Statement of Cash Flows Statement for the year ended 31 December 2017), following the same methodology used in 2016. |
Consolidated Balance Sheet and Capital Expenditure
Total assets at 31 December 2017 stood at EUR 4,056 million, a 40% increase compared with the year-end December 2016, as a result of the investments made during the 2017. Around 71% of total assets relates to property, plant and equipment and other intangible assets, in line with the nature of the Group’s business related to the management of terrestrial telecommunications infrastructure. The increase in property, plant and equipment and other intangible assets is a result of the above-mentioned acquisitions.
Consolidated net equity amounted to EUR 645 million, a 17% increase on year-end 2016, mainly due to the profit generated during the year, the final dividend and the acquisition of treasury shares.
Total capital expenditure for the year ended 31 December 2017 and 2016, including property, plant and equipment, intangible assets, advance payments on ground rentals and business combinations are summarised as follows:
| Consolidated Balance Sheet and Capital Expenditure (Thousands of Euros) |
|
| 31 December 2017 | 31 December 2016 |
| Maintenance capital expenditures (1) | 25,348 | 21,423 |
| Expansion capital expenditures (2) | 139,885 | 57,307 |
| M&A capital expenditures (3) | 1,017,454 | 705,556 |
| Total investment | 1,182,687 | 784,286 |
(1) Maintenance capital expenditures: investments in existing tangible or intangible assets, such as investment in infrastructure, equipment and information technology systems, and are primarily linked to keeping sites in good working order, but which excludes investment in increasing the capacity of sites.
(2) Expansion capital expenditures: Site adaptation for new tenants, ground leases (cash advances and land acquisitions), built-to-suit (Bouygues and Sunrise programmes), and other efficiency measures associated with energy and connectivity. Following the same methodology used in 2016.
(3) M&A capital expenditures: Investments in shareholdings of companies as well as significant investments in acquiring portfolios of sites (asset purchases) |
Information relating to the deferred of payments to suppliers
See Note 14 of the accompanying consolidated financial statements.
Use of financial instruments
See Note 4 of the accompanying consolidated financial statements.
GRI: 102-7, management approach for indirect economic impacts (103-1, 103-2, 103-3), 203-1