Creating value in the company
Cellnex's Financial Structure
Cellnex' borrowings are represented by a combination of loans, credit facilities and bonds issues. As at 31 December 2017, the total limit of loans and credit facilities available was EUR 1,695,922 thousand (EUR 960,348 thousand as at 31 December 2016), of which EUR 1,152,351 thousand represents credit facilities and EUR 543,571 thousand in loans (EUR 868,098 thousand in credit facilities and EUR 92,250 thousand in loans as at 31 December 2016). In addition, the total outstanding amount in bonds was EUR 1,890,000 thousand (EUR 1,415,000 thousand as at 31 December 2016).
As at 31 December 2017, Cellnex weighted average cost of debt (considering both the drawn and undrawn borrowings) was 2.0%(3) (2.0% as at 31 December 2016) and the weighted average cost of debt (considering only the drawn down borrowings) was 2.4% (2.5% as at 31 December 2016).
| Cellnex´s Financial Structure (Thousands of Euros) |
|
| Notional as of 31 December 2017 | Notional as of 31 December 2016 |
| | Limit | Drawn | Undrawn | Limit | Drawn | Undrawn |
| Bond issues | 1,890,000 | 1,890,000 | - | 1,415,000 | 1,415,000 | - |
| Loans and credit facilities | 1,695,922 | 635,852 | 1,060,070 | 960,348 | 280,552 | 679,796 |
| Total | 3,585,922 | 2,525,852 | 1,060,070 | 2,375,348 | 1,695,552 | 679,796 |

The following graph sets forth Cellnex’s notional contractual obligations in relation to borrowings as of 31 December 2017 (EUR million):
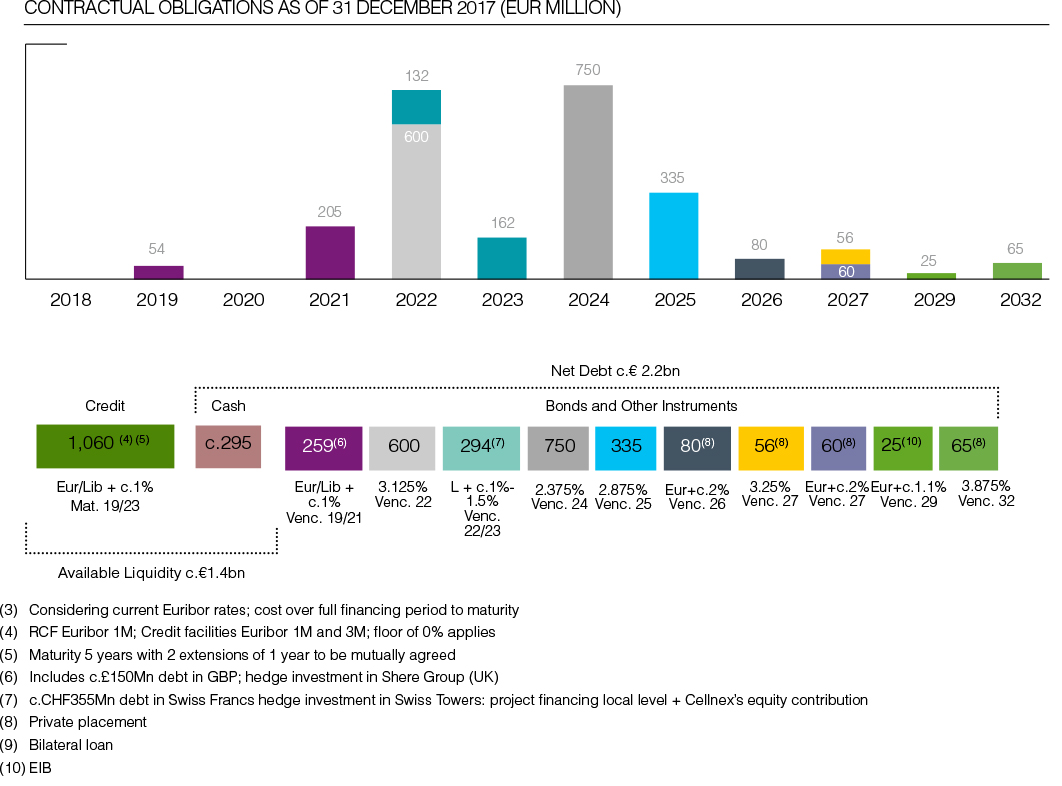
The Group’s borrowings were arranged under market conditions, therefore their fair value does not differ significantly from their carrying amount.
In accordance with the foregoing and with regard to the financial policy approved by the Board of Directors, the Group prioritises securing sources of financing at Parent Company level. The aim of this policy is to secure financing at a lower cost and longer tenure while diversifying its funding sources. In addition, this encourages access to capital markets and allows greater flexibility in financing contracts to promote the Group’s growth strategy.
Liquidity and Capital Resources
On 31 December 2017, net bank borrowings and bond issues amounted to EUR 2,237 million (EUR 1,499 million as at 31 December 2016), including a consolidated cash and cash equivalents position of EUR 295 million (EUR 193 million as at 31 December 2016). The ratio of net bank borrowings and bond issues to Adjusted annualised EBITDA amounts to 5.5x (11) (4.6x in December 2016).
The breakdown of the available liquidity at 31 December 2017 and 2016 is as follows:
The average annual cost on 31 December 2017 of all available borrowings would be 2.0% if entirely drawn down (2.0% in 2016).
Regarding the Corporate Rating, at 31 December 2017, Cellnex holds a long term “BBB-“ (investment grade) with negative outlook according to the international credit rating agency Fitch Ratings Ltd. and a long-term “BB+” with stable outlook according to the international credit rating agency Standard & Poor’s Financial Services LLC.
(11) The ratio is calculated as 12-month forward-looking Adjusted EBITDA (see outlook 2018), divided by net debt 2017.
| Bank borrowings and bond issues (Thousands of Euros) |
|
| 31 December 2017 | 31 December 2016 |
| Bank borrowings (Note 13) | 633,189 | 281,839 |
| Bond issues (Note 13) | 1,898,619 | 1,410,466 |
| 2,531,808 | 1,692,305 |
| | | |
| Cash and equivalents (Note 11) | (295,173) | (192,851) |
| Net bank borrowings and bond issues | 2,236,635 | 1,499,454 |
| Breakdown of the available liquidity at 31 December 2017 and 2016 (Thousands of Euros) |
|
| 31 December 2017 | 31 December 2016 |
| Available in credit facilities (Note 13) | 1,060,070 | 679,797 |
| Cash and cash equivalents (Note 11) | 295,173 | 192,851 |
| Available liquidity at 31 December 2017 | 1,355,243 | 872,648 |
Shareholder remuneration
The Board of Directors of the Parent Company adopted a resolution to propose to the Annual General Meeting a final cash dividend of EUR 0.042325 gross per share against 2016 profit, which was paid on 11 May 2017.
During the 2017 financial year an interim cash dividend amounting to EUR 10 million was distributed, which represents EUR 0.04 gross per each share that makes up the share capital of Cellnex Telecom, S.A. (EUR 10 million at year-end 2016, representing EUR 0.04 gross per share).
Along with the final cash dividend of EUR 12 million to be paid in 2018 (pursuant to the corresponding approval by the AGM), the total cash dividend distribution against 2017 results or reserves will have increased by 10% in relation to the dividend distributed against 2016 results.
2017-2019 Dividend Policy
The following Dividend Policy shall be applicable:
- 2017: dividend, which will be distributed against 2017 Net Profit, will be equivalent to that of 2016 (€20Mn against 2016 Net Profit) increased by 10%.
- 2018: dividend, which will be distributed against 2018 Net Profit, will be equivalent to that of 2017, increased by 10%.
- 2019: dividend, which will be distributed against 2019 Net Profit, will be equivalent to that of 2018, increased by 10%.
The payment of the dividends will be made on the specific dates to be determined in each case and will be duly announced.
Notwithstanding the above, the Company’s ability to distribute dividends depends on a number of circumstances and factors including, but not limited to, net profit attributable to the Company, any limitations included in financing agreements and Company’s growth strategy. As a result, such circumstances and factors may modify this Dividend Policy. In any case, any future amendment on this policy will be duly announced.
This Dividend Policy aims at keeping the appropriate balance between, shareholder remuneration, Company’s profit generation and Company’s growth strategy, ensuring an adequate capital structure.
Cellnex's tax contribution
The Cellnex fiscal strategy sets out the fundamental guidelines governing the decisions and actions of the Cellnex Group in taxation matters. The Company has also developed a standard for control and management of fiscal risks, which defines the principles and structure of the framework for managing and monitoring such risks.
The Group acts responsibly in tax matters in its business management and meets its tax obligations in all the countries in which it operates, currently Spain, Italy, the Netherlands, France, the UK and Switzerland, applying consistent fiscal criteria in accordance with regulations, Statute and case law and maintaining appropriate relations with the corresponding tax authorities.
Cellnex is also sensitive to and aware of its responsibility in the economic development of the territories in which it operates, helping to create economic value by paying taxes, both on its own account and those collected from third parties. Accordingly, it makes a substantial effort and pays great attention to fulfilling its tax obligations, in accordance with the applicable rules in each territory.
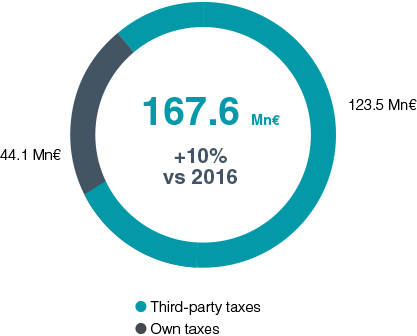
Following OECD methodology on cash basis accounting, Cellnex's total tax contribution in 2017 was € 167.6 million (151.9 in FY 2016). Own taxes are those paid by the company and third party taxes are those collected and aid into the various tax offices on behalf of such third parties, therefore they are not a cost to the company.
| Cellnex's total tax contribution in 2017 (€ million) |
|
| Own taxes (1) | Third-party taxes (2) | Total |
| Spain | 27.7 | 78 | 105.7 |
| Italy | 11.4 | 33.5 | 44.9 |
| France | 0.03 | - | 0.03 |
| Netherlands | 1 | 7.3 | 8.3 |
| United Kingdom | 0.8 | 1.7 | 2.5 |
| Switzerland | 3.2 | 3 | 6.2 |
| Total | 44.1 | 123.5 | 167.6 |
(1) Includes taxes that are an effective cost to the company (basically includes payments of income tax, local taxes,miscellaneous taxes and employer’s social security contributions).
(2) Includes taxes that do not affect the result but are collected by Cellnex on behalf of the tax administration or arepaid in for third parties ( basically includes net value added tax, deductions from employees and third parties,and employees’ Social Security contributions). |
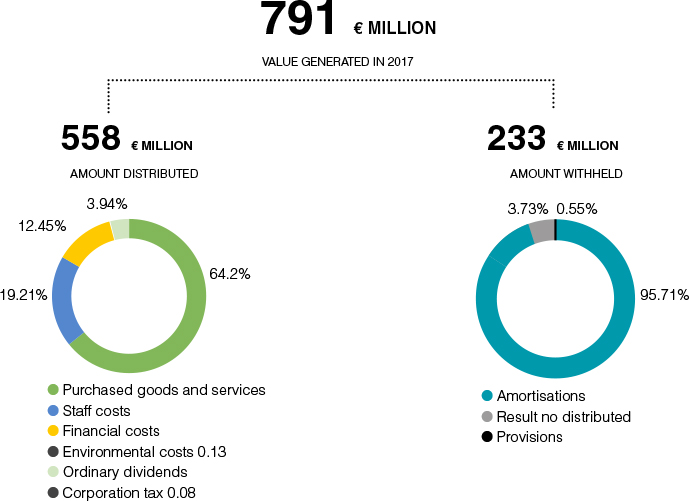
Value generated and distributed
Value generated in 2017 by Cellnex reached 791 € million, distributed mainly to suppliers, employees, shareholders and public administration.
GRI: 102-7, management approach for economic performance (103-1, 103-2, 103-3)