The year that ended on 31 December 2022 highlighted a unique combination of defensive and high-quality structural growth with limited exposure to COVID-19 and the Russian invasion of Ukraine, which was possible through consistent and sustainable organic growth, solid financial performance and a tireless focus on integration.
An Alternative Performance Measure (APM) is a financial measure of historical or future financial performance, financial position, or cash flows, other than a financial measure defined or specified in the applicable financial reporting framework.
Cellnex believes that there are certain APMs, used by the Group’s Management in making financial, operational and planning decisions, which provide useful financial information that should be considered in addition to the financial statements prepared in accordance with the applicable accounting regulations (IFRS-EU), in assessing its performance. These APMs are consistent with the main indicators used by the community of analysts and investors in the capital markets.
In accordance with the provisions of the Guide issued by the European Securities and Markets Authority (ESMA), in force since 3 July 2016, on the transparency of Alternative Performance Measures, Cellnex provides below information on the following APMs: Adjusted EBITDA; Adjusted EBITDA Margin; Gross and Net Financial Debt; Capital Expenditures; Net Payment of Interest; Available Liquidity, Recurring Leveraged Free Cash Flow and Free Cash Flow.
Adjusted EBITDA, Recurring Leveraged Free Cash Flow and Capital Expenditures indicators are Alternative Performance Measures (“APM”) as defined in the guidelines issued by the European Securities and Markets Authority on 5 October 2015 on Alternative Performance Measures (the “ESMA Guidelines”).
The definition and determination of the aforementioned APMs are disclosed in the accompanying Consolidated Management Report and are therefore validated by the Group auditor (Deloitte). The CNMV also conducted a review of the APMs as of December 2021.
The Company presents comparative financial information from the previous year as detailed in Note 2.e to the accompanying consolidated financial statements.
This relates to the “Operating profit” before “Depreciation, amortisation and results from disposals of fixed assets” and after adding back certain non-recurring expenses (such as COVID donations, redundancy provision, extra compensation and benefit costs, and costs and taxes related to acquisitions, among others), certain non-cash expenses (such as LTIP remuneration payable in shares, among others) and advances to customers.
The Group uses Adjusted EBITDA as an indicator of the operating performance of its business units and it is widely used as an evaluation metric among analysts, investors, rating agencies and other stakeholders. At the same time, it is important to highlight that Adjusted EBITDA is not a measure adopted in accounting standards and, therefore, should not be considered an alternative to cash flow as an indicator of liquidity. Adjusted EBITDA does not have a standardised meaning and cannot therefore be compared with the Adjusted EBITDA of other companies.
One commonly used metric that is derived from Adjusted EBITDA is Adjusted EBITDA margin, as described below.
|
Thousands of euros |
||
|
Adjusted EBITDA |
31 December 2022 |
31 December 2021 restated |
|
Broadcasting infrastructure |
223,497 |
218,290 |
|
Telecom Infrastructure Services |
3,159,629 |
2,211,789 |
|
Other Network Services |
112,054 |
102,720 |
|
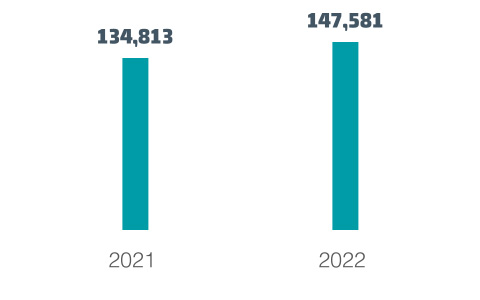
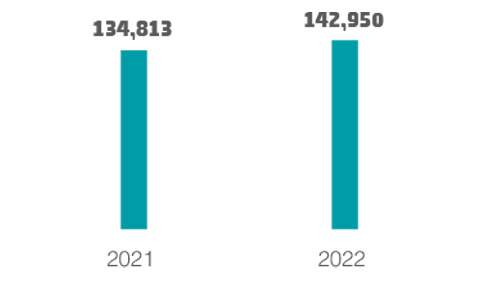
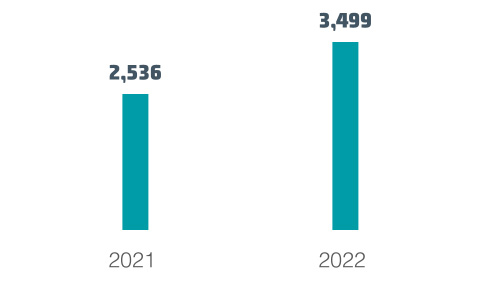
Operating income1 |
3,495,180 |
2,532,799 |
|
Staff costs2 |
(270,383) |
(300,357) |
|
Repairs and maintenance3 |
(91,969) |
(79,708) |
|
Utilities3 |
(283,085) |
(159,080) |
|
General and other services3 |
(298,733) |
(249,153) |
|
Depreciation, amortisation and results from disposals of fixed assets4 |
(2,320,694) |
(1,676,323) |
|
Operating profit |
230,316 |
68,178 |
|
Depreciation, amortisation and results from disposals of fixed assets4 |
2,320,694 |
1,676,323 |
|
Non-recurring expenses5 |
75,983 |
172,941 |
|
Advances to customers5 |
3,442 |
3,269 |
|
Adjusted operating profit before depreciation and amortisation charge (Adjusted EBITDA) |
2,630,435 |
1,920,711 |
As at 31 December 2022 and 2021, respectively, the amounts were as follows:
Non-recurring and non-cash expenses, and advances to customers at 31 December 2022 and 2021 are set out below (see Note 20.d to the accompanying consolidated financial statements):
During 2022 Cellnex carried out several business combinations. If all the business combinations carried out during 2022 had been completed by 1 January 2022 and had been fully consolidated for the full year ended on 31 December 2022, the Adjusted EBITDA would have amounted to some EUR 2,852 million and the payments of lease instalments in the ordinary course of business would have been approximately EUR 837 million.
Adjusted EBITDA Margin corresponds to Adjusted EBITDA (as defined above), divided by operating income6 excluding elements passed through7 to customers from both expenses and revenues, mostly electricity costs (this item only includes Services and Advances to customers8 and does not take into account of Other operating income). The Group uses Adjusted EBITDA Margin as an operating performance indicator and it is widely used as an evaluation metric among analysts, investors, rating agencies and other stakeholders.
Accordingly, the Adjusted EBITDA9 Margin as at 31 December 2022 and 2021 was 81% and 79%, respectively.
The Gross Financial Debt corresponds to “Bond issues and other loans”10, “Loans and credit facilities”11 and “Lease liabilities”12, but does not include any debt held by Group companies registered using the equity method of consolidation, “Derivative financial instruments”13 or “Other financial liabilities”15. "Lease liabilities" is calculated as the present value of lease payments payable over the lease term, discounted at the rate implicit or at the incremental borrowing rate.
In line with the above, its value as at 31 December 2022 and 2021, respectively, is as follows:
|
Thousands of euros |
||
|
Gross Financial Debt |
31 December 2022 |
31 December 2021 restated |
|
Bond issues and other loans |
14,045,410 |
13,565,690 |
|
Loans and credit facilities |
3,838,178 |
2,064,351 |
|
Lease liabilities |
3,085,490 |
2,905,762 |
|
Gross Financial Debt |
20,969,078 |
18,535,803 |
The Net Financial Debt corresponds to "Gross financial debt” less “Cash and cash equivalents”14 and "Other financial assets"15. Together with Gross Financial Debt, the Group uses Net Financial Debt as a measure of its solvency and liquidity as it indicates the current cash and equivalents in relation to its total debt liabilities. One commonly used metric that is derived from Net Financial Debt is "Net Financial Debt / Adjusted EBITDA" which is frequently used by analysts, investors and rating agencies as an indication of financial leverage.
“Net financial debt” at 31 December 2022 and 2021 is as follows:
|
Thousands of euros |
||
|
Net Financial Debt |
31 December 2022 |
31 December 2021 restated |
|
Gross financial debt |
20,969,078 |
18,535,803 |
|
Cash and cash equivalents |
(1,038,179) |
(3,926,578) |
|
Other financial assets |
(93,242) |
— |
|
Net Financial Debt |
19,837,657 |
14,609,225 |
At 31 December 2022, net financial debt amounted to EUR 19,838 million (EUR 14,609 million in 2021 restated), including a consolidated cash and cash equivalents position of EUR 1,038 million (EUR 3,927 million in 2021) and EUR 93 million of other financial assets.
|
Thousands of euros |
||
|
Net Financial Debt evolution |
31 December 2022 |
31 December 2021 restated |
|
Beginning of Period |
14,609,225 |
6,493,463 |
|
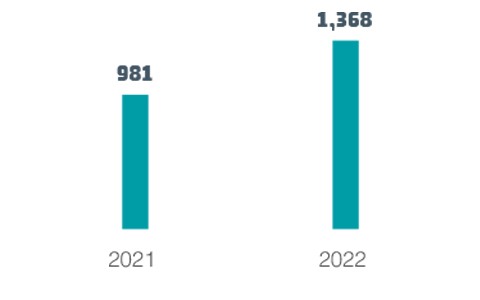
Recurring leveraged free cash flow |
(1,367,925) |
(980,543) |
|
Expansion (or organic growth) capital expenditures |
349,553 |
233,107 |
|
Expansion capital expenditures (Build to Suit programs) and Remedies |
2,133,206 |
1,346,136 |
|
M&A Capital Expenditures (1) |
3,542,589 |
12,529,294 |
|
Non-Recurrent Items (cash only) (2) |
59,334 |
81,346 |
|
Other Net Cash Out Flows (3) |
(137,129) |
1,349 |
|
Issue of equity instruments, Treasury Shares and Payment of Dividends (4) |
338,842 |
(6,765,675) |
|
Change in Lease Liabilities (5) |
179,728 |
1,149,717 |
|
Accrued Interest Not Paid and Others (6) |
130,234 |
521,031 |
|
End of Period |
19,837,657 |
14,609,225 |
(1) See footnote 9 in heading “Recurring leveraged free cash flow” of the accompanying Consolidated Management Report.
(2) See footnote 10 in heading “Recurring leveraged free cash flow” of the accompanying Consolidated Management Report.
(3) Corresponds to "Other Net Cash Out Flows" (see footnote 12 in heading "Recurring Leveraged Free Cash Flow" of the accompanying Consolidated Management Report), excluding other financial assets (€93Mn, see note 13.b to the accompanying Consolidated Financial Statements).
(4) Mainly corresponds to "Issue of equity instruments, Acquisition of Treasury Shares and Dividends paid" in the accompanying Consolidated Statement of Cash Flows for the period ended 31 December 2022, minus the contribution of minority shareholders (€16Mn, see the relevant section in the Consolidated Statement of Changes in Net Equity).
(5) Changes in “Lease liabilities” long and short term to the accompanying Consolidated Balance Sheet as of 31 December 2022. See Note 16 to the accompanying consolidated financial statements
(6) “Accrued interest not paid and others” include, mainly, arrangement expenses accrued and change in interest accrued not paid, as well as the debt assumed on the T-Mobile Infra Acquisition as of 31 December 2021 (See Note 6 to the accompanying Consolidated Financial Statements).
Net Payment of Interest corresponds to i) “interest payments on lease liabilities”16 plus ii) “Net payment of interest (not including interest payments on lease liabilities)” and iii) non-recurring financing costs related to M&A projects17.
The reconciliation of the heading “Net Payment of Interest” from the Consolidated Statement of Cash Flows corresponding to the year ended on 31 December 2022 and 2021, with the “Net financial loss” in the Consolidated Income Statement is as follows:
|
Thousands of euros |
||
|
Net Payment of Interest |
31 December 2022 |
31 December 2021 restated |
|
Interest Income18 |
22,519 |
4,416 |
|
Interest Expense 19 |
(751,478) |
(609,679) |
|
Bond & loan interest accrued not paid |
164,621 |
134,998 |
|
Amortised costs – non-cash |
93,913 |
121,725 |
|
Interest accrued in prior year paid in current year |
(134,998) |
(89,260) |
|
Net Payment of Interest as per the Consolidated Statement of Cashflows (1) |
(605,423) |
(437,800) |
(1) Net payment of interest as per the Consolidated Statement of Cash Flows, which corresponds to i) “interest payments on lease liabilities” for an amount of €327,405 thousand (see Note 16 to the accompanying consolidated financial statements) plus ii) “Net payment of interest" (not including interest payments on lease liabilities) for an amount of €257,652 thousand (see section “Recurring leveraged free cash flow” of the accompanying Consolidated Management Report) and plus iii) non-recurring financing costs related to M&A projects (€20,366 thousand, see heading “Recurring leveraged free cash flow” of the accompanying Consolidated Management Report).
The Group considers as Available Liquidity the available cash and available credit lines at year-end closing, as well as other financial assets described in Note 13.b of the accompanying consolidated financial statements.
The breakdown of the available liquidity at 31 December 2022 and 2021 is as follows:
|
Thousands of Euros |
||
|
Liquidity availability |
31 December 2022 |
31 December 2021 |
|
Available in credit facilities |
3,344,826 |
4,734,696 |
|
Cash and cash equivalents20 |
1,038,179 |
3,926,578 |
|
Other financial assets21 |
93,242 |
— |
|
Available Liquidity |
4,476,247 |
8,661,274 |
The Group considers Capital Expenditures as an important indicator of its operating performance in terms of investment in assets, including their maintenance, organic and build-to-suit expansion, and acquisition. This indicator is widely used in the industry in which the Group operates as an evaluation metric among analysts, investors, rating agencies and other stakeholders.
The Group classifies its Capital Expenditures in four main categories:
Includes investments in existing tangible or intangible assets, such as investment in infrastructure, equipment and information technology systems, and are primarily linked to keeping infrastructure, active and passive equipment, in good working order. Maintenance Capex also includes network maintenance, such us corrective maintenance (responses to network incidents and preventive inspections, e.g. replacement of air conditioning or electrical equipment), statutory maintenance (mandatory inspections owing to regulatory obligations, e.g. infrastructure certifications, lightning certifications), network renewal and improvements (renewal of obsolete equipment and assets improvement, e.g. tower reinforcement, battery renewal, phase-out management), continuity plans (specific plans to mitigate risk of infrastructure collapse or failure with existing services or assets not compliant with regulations), re-roofing (solutions to allow landlords' roofing work and avoid service discontinuity or building repairs attributable to Cellnex) as well as other non-network maintenance activities, such us business maintenance (infrastructure adaptations for tenants, upgrades not managed via Engineering Services, or capex to renew customer contracts without revenue increases), IT systems or repairs and maintenance of offices, as well as Engineering Services.
Includes adapting sites for new tenants, ground leases (cash advances), and efficiency measures associated with energy and connectivity, and early site adaptation to increase site capacity, and also Engineering Services. Thus, it corresponds to investments related to business expansion that generates additional Recurring Leveraged Free Cash Flow (including among other things, decommissioning, adaptation of telecom sites for new tenants, Engineering Services and prepayments of land leases).
Corresponds to committed build-to-suit programmes (consisting of sites, backhaul, backbone, edge computing centres, DAS nodes or any other type of telecommunication infrastructure as well as any advanced payment related to it or further initiatives) and also Engineering Services that have been contracted with different customers, including any ad-hoc capex required. Cash-in from the disposal of assets (or shares) due to autorithy bodies' decisions are considered within this item.
Corresponds to investments in shareholdings of companies (excluding the amount of deferred payments in business combinations that are payable in subsequent periods) as well as significant investments in acquiring portfolios of sites or land (asset purchases).
Total Capital Expenditure for the years ended 31 December 2022 and 2021, including property, plant and equipment, intangible assets, advance payments on land leases and business combinations, is summarised as follows:
|
Thousands of euros |
||
|
Capital expenditures |
31 December 2022 |
31 December 2021 restated |
|
Maintenance capital expenditures |
107,726 |
76,799 |
|
Expansion (or organic growth) capital expenditures |
349,553 |
233,107 |
|
Expansion capital expenditures (Build to Suit programs) and Remedies |
2,133,206 |
1,346,136 |
|
Expansion capital expenditures (Build to Suit programs) |
2,282,650 |
1,346,136 |
|
Remedies (2) |
(149,444) |
— |
|
M&A capital expenditures |
4,881,163 |
12,741,420 |
|
Total investment (1) |
7,471,648 |
14,397,463 |
(1)“Total Investment”, amounting to €7,472Mn (€14,397Mn in 2021), corresponds to “Total net cash flow from investment activities” in the accompanying Consolidated Statement of Cash Flows amounting to €5,950Mn (€13,904Mn in 2021), plus i) “Cash and cash equivalents” of the acquired companies in business combinations amounting to €101Mn (€211Mn in 2021, see Note 8 to the accompanying consolidated financial statements); plus ii) "Cash advances to landlords" amounting to €133Mn (€71Mn in 2021, see Note 16 to the accompanying Consolidated Financial Statements); plus iii) the payment for the Hutchison UK acquisition through Cellnex Telecom SA shares (€1,237Mn, see Note 6 to the accompanying consolidated financial statements); plus iv) "Others" amounting to €51Mn (€210Mn in 2021), which includes, mainly, timing effects related to assets purchases, the reimbursement of contributions of the initial investment in DIV (€52Mn, see note 10 to the accompanying Consolidated Financial Statements) and other financial assets (€-93Mn, see note 13.b to the accompanying Consolidated Financial Statements).
(2) Corresponds to the total price in relation to the Divestment Remedy with WIG in the United Kingdom.
The Group considers Recurring Leveraged Free Cash Flow to be one of the most important indicators of its ability to generate stable and growing cash flows which allows it to guarantee the creation of value, sustained over time, for its shareholders.
At 31 December 2022 and 2021 the Recurring Leveraged Free Cash Flow ("RLFCF") was calculated as follows:
|
Thousands of euros |
||
|
Recurring Leveraged Free Cash Flow |
31 December 2022 |
31 December 2021 restated |
|
Adjusted EBITDA (1) |
2,630,435 |
1,920,711 |
|
Payments of lease installments in the ordinary course of business and interest payments (2) |
(791,743) |
(593,598) |
|
Maintenance capital expenditures (3) |
(107,726) |
(76,799) |
|
Changes in current assets/current liabilities (4) |
(16,803) |
(68) |
|
Net payment of interest (5) |
(257,652) |
(182,533) |
|
Income tax payment (6) |
(88,586) |
(87,170) |
|
Recurring Leveraged Free Cash Flow (RLFCF) |
1,367,925 |
980,543 |
|
Expansion (or organic growth) capital expenditures (7) |
(349,553) |
(233,107) |
|
Expansion capital expenditures (Build to Suit programs) and Remedies (8) |
(2,133,206) |
(1,346,136) |
|
M&A capital expenditures (9) |
(3,542,589) |
(12,529,294) |
|
Non-Recurrent Items (cash only) (10) |
(59,334) |
(81,346) |
|
Net Cash Flow from Financing Activities (11) |
1,784,471 |
12,485,240 |
|
Other Net Cash Out Flows (12) |
43,887 |
(1,349) |
|
Net Increase of Cash (13) |
(2,888,399) |
(725,449) |
(1) Adjusted EBITDA: Profit from operations before D&A (after IFRS 16 adoption) and after adding back (i) certain non-recurring items (such as COVID donations (€2Mn), costs and taxes related to acquisitions (€54Mn) and redundancy provision (€3Mn)) and/or (ii) certain non-cash items (such as advances to customers (€3Mn) which include the amortisation of amounts paid for sites to be dismantled and their corresponding dismantling costs, and LTIP remuneration payable in shares (€17Mn)).
(2) Corresponds to i) payments of lease instalments (€464Mn) in the ordinary course of business and; ii) interest payments on lease liabilities (€327Mn). See Note 16 to the accompanying consolidated financial statements.
(3) Maintenance capital expenditures: see definition in section "Alternative Performance Measures".
(4) Changes in current assets/current liabilities (see the relevant section in the Consolidated Statement of Cash Flows for the year ended on 31 December 2022).
(5) Corresponds to the net of “Interest paid” and “interest received” in the accompanying Consolidated Statement of Cash Flows for the year ended on 31 December 2022 (€605Mn), excluding “Interest payments on lease liabilities” (€327Mn) (see Note 16 to the accompanying consolidated financial statements) and non-recurring financing costs related to M&A projects (see footnote 11).
(6) Corresponds to "Income Tax received/(paid)" in the accompanying Consolidated Statement of Cash Flows for the year ended on 31 December 2022.
(7) Investment related to business expansion that generates additional RLFCF, including among others, decommissioning, telecom site adaptation for new tenants, Engineering Services and prepayments of land leases. Corresponds to cash advances to landlords (€133Mn), efficiency measures associated with energy and connectivity (€51Mn), and others (€166Mn, including early site adaptation to increase the capacity of sites).
(8) Committed Build-to-Suit Programmes (consisting of sites, backhaul, backbone, edge computing centres, DAS nodes or any other type of telecommunication infrastructure as well as any advanced payment related to it or further initiatives) and also Engineering Services that have been contracted with different clients, including any ad-hoc capex required, as well as cash-in from the disposal of assets (or shares) due to antitrust bodies’ decisions. As of 31 December 2022 includes prepayments in France (see Note 8 to the accompanying Consolidated Financial Statements) in relation to committed Build-to-Suit Programmes, and further initiatives as well as the impact of Remedies (€149Mn, see caption “Capital Expenditures” in the accompanying Consolidated Directors’ Report for the year ended on 31 December 2022).
(9) Corresponds to investments in shareholdings of companies as well as significant investments in acquiring portfolios of sites or land (asset purchases), after integrating into the consolidated balance sheet mainly the "Cash and cash equivalents" of the acquired business. Mainly correspond to the acquisition of Hutchison UK and Iliad minority stakes in France and Poland.
The amount resulting from (3)+(7)+(8)+(9), hereinafter the “Total Capex” (€6,133Mn), corresponds to “Total Investment” (€7,472Mn, see heading “Capital Expenditures” in the accompanying Consolidated Directors’ Report for the year ended on 31 December 2022) minus the payment for the Hutchison UK acquisition through Cellnex Telecom SA shares (€1,237Mn, see Note 6 to the accompanying consolidated financial statements) and the “Cash and cash equivalents” of the acquired companies (€101Mn, see Note 6 to the accompanying consolidated financial statements).
Total Capex (€6,133Mn) also corresponds to “Total net cash flow from investing activities” (€5,950Mn, see the relevant section in the accompanying Consolidated Statement of Cash Flows for the year ended on 31 December 2022) + Cash advances to landlords (€133Mn, see Note 16 to the accompanying Consolidated Financial Statements) + Others (€51Mn, which includes, mainly, timing effects related to assets purchases, the reimbursement of contributions of the initial investment in DIV (€+52Mn, see note 10 to the accompanying Consolidated Financial Statements), and other financial assets (€-93Mn, see note 13.b to the accompanying Consolidated Financial Statements)).
(10) Consists of "non-recurring expenses and advances to customers" that have involved cash movements, mainly corresponding to "Costs and taxes related to acquisitions"(€54Mn), "redundancy provision" (€3Mn) and "COVID donations" (€2Mn).
(11) Corresponds to “Total net cash flow from financing activities” (€1,224Mn, see the relevant section in the accompanying Consolidated Statement of Cash Flows for the year ended on 31 December 2022), plus: i) payments of lease instalments (€464Mn) in the ordinary course of business (see footnote 2) and ii) Cash advances to landlords (€133Mn) (see footnote 7), minus: i) the contribution of minority shareholders (€16Mn, see the relevant section in the Consolidated Statement of Changes in Net Equity), and ii) on-recurring financing costs related to M&A projects (€20Mn, see heading "Net Payment of Interest").
(12) Mainly corresponds to timing effects related to assets purchases, the reimbursement of contributions of the initial investment in DIV (see footnote 9) and "Foreign exchange differences" (see the relevant section in the Consolidated Statement of Cash Flows for the year ended on 31 December 2022), partly offset by the Reorganisation Plan (see Note 19.b to the accompanying Consolidated Financial Statements), other financial assets (see footnote 9) and other impacts.
(13) “Net (decrease)/increase in cash and cash equivalents from continuing operations” (see the relevant section in the accompanying Consolidated Statement of Cash Flow for the year ended on 31 December 2022).
Free Cash Flow is defined as RLFCF after deducting BTS Capex (that includes cash-in from Remedies) and Expansion Capex (and Engineering Services Capex should the latter be reported under a dedicated Capex line).
|
Thousands of euros |
||
|
Free Cash Flow |
31 December 2022 |
31 December 2021 restated |
|
Recurring leveraged free cash flow (RLFCF) |
1,367,925 |
980,543 |
|
Expansion capital expenditures (build-to-suit programmes) and Remedies |
(2,133,206) |
(1,346,136) |
|
Expansion (or organic growth) capital expenditures |
(349,553) |
(233,107) |
|
Free Cash Flow |
(1,114,834) |
(598,700) |
Revenues and results correspond to the Operating Income22 from the consolidated profit and loss account without considering advances paid to customers.
Operating Income for the year ended in December 2022, by country and type of service, can be broken down as follows: Spain amounted to EUR 566 million (of which i) Telecom Infrastructure Services ("TIS") accounted for EUR 234 million – EUR 179 million colocations and DAS, EUR 6 million Engineering Services, EUR 47 million pass-through and EUR 2 million data centres –, ii) Broadcasting Infrastructure EUR 223 million and iii) Other Network Services EUR 109 million, while fibre revenues reported both at Telecom Infrastructure Services and Other Network Services amounted to EUR 35 million), Italy amounted to EUR 735 million (entirely from Telecom Infrastructure Services – EUR 567 million colocations and DAS, EUR 22 million Engineering Services and EUR 146 million pass-through), France amounted to EUR 749 million (entirely from Telecom Infrastructure Services – EUR 607 million colocations and DAS, EUR 97 million Engineering Services, EUR 12 million pass-through, EUR 18 million data centres and EUR 15 million fibre –) and Rest of Europe amounted to EUR 1,446 million (of which, Telecom Infrastructure Services accounted for EUR 1,444 million – EUR 1,185 million colocations and DAS, EUR 143 million Engineering Services the largest contributors being the i) UK with EUR 92 million, ii) Switzerland with EUR 19 million, iii) Poland with EUR 15 million and iv) Portugal with EUR 12 million, EUR 111 million pass-through, EUR 5 million data centres and EUR 0.4 million fibre and Other Network Services for EUR 2 million). The Operating Income breakdown in 2021 was: Spain EUR 530 million (of which, Telecom Infrastructure Services accounted for EUR 211 million, EUR 155 million colocations and DAS, EUR 0 million Engineering Services, EUR 55 million pass-through and EUR 1 million data centres–, Broadcasting Infrastructure for EUR 218 million and Other Network Services for EUR 101 million, while fibre revenues reported both at Telecom Infrastructure Services and Other Network Services amounted to EUR 33 million), Italy amounted to EUR 512 million (entirely from Telecom Infrastructure Services – EUR 415 million colocations and DAS, EUR 19 million Engineering Services and EUR 78 million pass-through), France amounted to EUR 413 million (entirely from Telecom Infrastructure Services – EUR 334 million colocations and DAS, EUR 57 million Engineering Services, EUR 5 million pass-through, EUR 9 million data centres and EUR 8 million fibre –) and Rest of Europe amounted to EUR 1,078 million (of which, Telecom Infrastructure Services accounted for EUR 1,076 million – EUR 923 million colocations and DAS, EUR 89 million Engineering Services, the largest contributors being the UK with EUR 42 million, Switzerland with EUR 21 million, Poland with EUR 18 million and Portugal with EUR 8 million, EUR 61 million pass-through, EUR 3 million data centres and EUR 0.5 million fibre and Other Network Services for EUR 2 million).
Operating Income for the year ended on 31 December 2022 was EUR 3,495 million, which represents a 38% increase over 2021 year-end. This increase was due mainly to the consolidation of the business combinations carried out i) in 2021 in Sweden (the CK Hutchison Holdings transactions), Italy (the Hutchison Italy Acquisition), Poland (the Iliad Poland and Polkomtel Acquisitions), Portugal (the Infratower Acquisition), the Netherlands (T-Mobile Infra Acquisition) and France (the Hivory acquisition), as well as the acquisitions completed ii) during 2022 in Portugal (the Hivory Portugal Acquisition) and UK (the Hutchison United Kingdom Acquisition). See Note 6 to the accompanying consolidated financial statements.
Operating Income from Telecom Infrastructure Services income increased by 43% to EUR 3,160 million due to both the organic growth achieved and the acquisitions performed during 2022 and 2021, as detailed above. The Group provides its customers in Telecom Infrastructure Services with coverage-related services and access to the Group’s telecom or broadcasting infrastructures for MNOs to co-locate their equipment on the Group’s infrastructures, offering additional services that allow MNOs to rationalise their networks and optimise costs, through the dismantling of duplicate infrastructure (decommissioning) and building new infrastructure (build-to-suit) on strategic sites that can offer service to one or more MNOs. These services have the aim of completing the deployment of 4G and 5G in the future, reducing areas with no signal coverage and extending network densification. The Group acts as a neutral operator for MNOs (for example, by not having one or more MNOs as a significant shareholder represented on the Board of Directors or other governance bodies) and other telecom operators who generally require complete access to network infrastructure in order to provide services to end users. The Group acts as a multi-infrastructure operator. Its customers are responsible for the individual communication equipment hosted in the Group’s telecom and broadcasting infrastructure. Telecom Infrastructure Services are generated from a number of sources: i) annual base fee from telecommunications customers (both anchor and secondary tenants), ii) escalators or inflation as the annual update of the base fee and, iii) New colocations and Associated revenues (which include new third-party colocations as well as further initiatives carried out in the period such as special connectivity projects, indoor connectivity solutions based on DAS, mobile edge computing, fibre backhauling, site configuration changes as a result of 5G rollout and Engineering Services as well as housing services to broadcasters outside of Spain). The perimeter, therefore the number of tenants, may also be increased as a result of both acquisitions and executing BTS programmes. In addition to its current portfolio, the Group’s management remains open to selective acquisitions or even to potential divestments, in alignment with its demanding capital allocation policy. The foreseeable new technological requirements linked to 5G along with other ordinary maintenance services such as investment in infrastructure, equipment and information technology systems, generally at the request of its customers, will translate into asset investment commitments in the coming years. In this context, the Group carries out Engineering Services, consisting of works and studies such as adaptation, engineering and design services as well as Instalation Services at the request of its customers, which represent a separate income stream and performance obligation. Engineering Services carried out in Cellnex infrastructure are invoiced and accrued when the customer's request is finalised and collected in accordance with each customer agreement with certain margin28. Also, Engineering Services can be deployed under the heading of Capex Recovery which are carried out, invoiced, accrued and collected over several years with a certain margin28. The costs incurred in relation to these services, that will be classified as capital expenditures, can be an internal expense or otherwise outsourced and the revenue in relation to these services is generally recognised when the capital expense is incurred. The margin23 is significantly lower than the Adjusted EBITDA margin of the Group, tending to be a mid-single-digit percentage. In terms of Engineering Services, when a new PoP is installed, the following concepts are usually involved: As-Built drawings, strength calculation, reports (electro, static, EMF...), joint site survey, site adequacy, energy meter installation, access cards and keys or tower/mast modifications. On the other hand, Installation Services are a type of Engineering Services carried out mainly in Cellnex' infrastructure, accrued as projects progress, invoiced and collected in accordance with certain milestones. If the project is finalised and rejected by the customer, the cost is reclassified as an expense. Installation Services include the installation of customers' equipment on site, such as installation of antennae, microwave equipment or remote radio units. The total amount of revenues associated with these Engineering Services during 2022 was EUR 267Mn (EUR 164Mn during 2021). The total amount of Capital Expenditures incurred related to Engineering Services during 2022 is disclosed in Note 8 to the accompanying consolidated financial statements. Until 2022, Engineering Services were considered within the BTS programmes disclosed to the market: various acquisition business plans have contractualised Engineering Services. From 2023 onwards, if more Engineering Services are required, the Capital Expenditures associated with the projects will be reported within Expansion Capex or Maintenance Capex, depending on its nature and magnitude, and, if required, as a new capex line. Some of this capex devoted to Engineering Services, especially in the UK, can be advances of capex to be recovered through future Engineering Services revenues as well as the corresponding margin28(Capex Recovery).
The Group generally receives monthly payments from customers, payable under long-term contracts (which in the case of anchor customers have long or undefined maturities with automatic extensions, unless cancelled). The annual payments vary considerably depending upon numerous factors, including, but not limited to, the infrastructure location, the number and type of customer’s equipment on the infrastructure, ground space required by the customer, customer ratio, equipment at the infrastructure and remaining infrastructure capacity. The main costs typically include related services (which are primarily fixed, with annual cost escalations) such as energy and ground costs, property taxes and repairs and maintenance. The majority of the land and rooftops where the Group’s infrastructures are located, are operated and managed via lease contracts, sub-lease contracts or other types of contracts with third parties. In general, MNOs handle the maintenance of their own equipment under their responsibility, although in some cases they may subcontract to the Group the maintenance of their equipment as a separate and additional service.
In the context of 5G and its forecasted growth, Cellnex will continue expanding its presence in greenfield projects or "tower-adjacent assets" that are playing a key role in the 5G world such as; optical fibre, edge computing centres, RAN sharing or private networks, among others. Cellnex is committed to preserving its business model but also might expand into adjacent assets along its value chain and under the same tower economics (i.e., a B2B business model with limited churn risk, deep industrial rationale within the telecommunications ecosystem, with anchor tenants securing the majority of the expected future cash flows of projects, long term contracts with fixed fees that are CPI-linked or have a fixed escalator and ability to market infrastructure to third parties).
As disclosed in the January-September 2022 results presentation, the Group is currently evaluating a number of opportunities related to: i) supporting MNOs to improve their networks and increase coverage requiring RAN Sharing, FTTT, data centres , ii) enhancing public sector coverage in rural areas, providing mobile broadband connectivity through metropolitan transport systems, inter-city communications and motorway and railway environments, and improving public safety connectivity, iii) building private networks for enterprises in order to maximise industry uses. Cellnex estimates an aggregate pipeline of approximately EUR 11 billion, always subordinated to the achievement of Investment Grade and in accordance with its strict financial criteria.
Cellnex is also working on refinancing its short-term debt maturities, namely the EUR 750 million bond maturing in January 2024.Various refinancing alternatives, such as the issuance of a new straight bond or a new convertible bond, are being analysed.
Furthermore, those future agreements might allow Cellnex to offer additional services to existing partners with a gradual deployment, that is always commensurate with the next chapter of the Cellnex equity story and the strict M&A criteria.

The Group has extensive experience in DAS network solutions. The Group has deployed approximately 7,500 DAS nodes, with a customer ratio of three MNOs per infrastructure, in venues such as stadiums, skyscrapers, shopping malls, dense outdoor areas, airports, underground lines and railway stations. DAS is a network of spatially distributed anntenae connected to a common source, thus providing wireless service within a specific geographical area. The system can support a wide variety of technologies and frequencies, obviously including 2G, 3G, 4G and 5G in the future. The Group works as a true neutral host, together with the MNOs, in order to provide the optimal solution for the increasing need for coverage and densification in complex scenarios. The Group manages the complete life cycle of the solution: infrastructure acquisition, design, installation, commissioning, O&M, supervision and service quality assurance. The Group also operates the active network equipment for the DAS nodes that the Group manages.
The Group is also developing capabilities in fibre to the tower and edge computing centres infrastructure, in order to offer its customers the data-processing capacity distributed in the network, without which the potential of 5G could not be realised. For instance, in 2017 the Group acquired Alticom, a Dutch company that owns a portfolio of sites which has data centres, in 2018 and 2019 Cellnex signed an agreement to build 88 and acquire 62 edge computing centres for Bouygues Telecom and in 2020 it extended the scope to build another 90 sites with those characteristics with Bouygues Telecom in the context of the fibre co-investment deal to roll-out a transport network (backhaul and backbone) connecting all key elements of the telecom network of Bouygues Telecom over optical fibre. Also in Cellnex Netherlands, colocation to Broadcasters and also Broadcasting Services can be provided to customers. Please note that every revenue from Cellnex Netherlands is classified as TIS.
In general, the Group’s service contracts for colocation services with anchor customers have an initial non-cancellable term of 10 to 20 years, with multiple renewal terms (which in the case of anchor customers have long or undefined maturities with automatic extensions, unless cancelled, with "all or nothing" clauses), and payments that are typically revised based on an inflationary index like the consumer price index (CPI) or on fixed escalators. The Group’s customer contracts have historically had a high renewal rate. In this regard, the Telefónica contract, the first anchor customer that reached its initial term, has been successfully renewed. Contracts in place with Telefónica and Wind Tre may be subject to change in terms of the fees being applied at the time of a renewal, within a predefined range taking into account the last annual fee (which reflects the cumulative inflation of the full initial term), that in the case of Telefónica ranges from -5% to +5% (applicable after the initial period and the first two extension periods have elapsed) and from -15% to +5% for Wind Tre.
Operating Income from the Broadcasting Infrastructure business amounted to EUR 223 million, which represents a 2% increase compared with 2021 year-end. This business segment consists of the distribution and transmission of TV and radio signals as well as the O&M of broadcasting networks, the provision of connectivity for media content, OTT broadcasting services and other services, all of them in Spain. The provision of these services requires unique high-mast infrastructure that, in most cases, only the Group owns, substantial spectrum management know-how, and the ability to comply with very stringent service levels. In Spain, the Group covers more than 99% of the population with DTT and radio of the broadcast infrastructure, which is a portfolio larger than all of its competitors combined. The Group’s Broadcasting Infrastructure segment is characterised by predictable, recurrent and stable cash flows as well as in-depth technical know-how that allows the Group to provide consulting services. The Group classifies the services that it provides to its customers as a broadcast network operator in three groups: (i) Digital TV, (ii) Radio and (iii) Other broadcasting services. The Group’s customers within the Broadcasting Infrastructure segment include all national and most regional and local TV broadcasters as well as leading radio station operators in Spain. Some of the key customers for DTT services include Atresmedia, CTTI, Mediaset España, Net Televisión, Veo Televisión and RTVE. The DTT broadcasting contracts have no volume risk, but do feature stable and visible pricing of MUXs, compliance with applicable regulations and attractive indexation terms. The main features of the Group’s DTT broadcasting contracts are: medium-term contracts with high renewal rates, no volume risk, stable and visible pricing, and generally a high degree of indexation to the CPI that allows the Group to cover increases in operational costs where the CPI is positive (except for the RTVE contract that was renewed in 2023 with the same fees but with no annual escalator, while other nationwide broadcasters have indexing to the CPI capped at 3% when inflation stands at or below 5% and at 4% when inflation stands above 5%), as the decrease cannot be less than 0%. Note that Cellnex completed a general cycle of renewing contracts with customers in the broadcasting field, although in recent years the relative weight of this segment has decreased significantly. The strategy in this business segment is to maintain its strong market position while capturing potential organic growth. Cellnex plans to maintain its leading position in the Spanish national digital TV sector (in which it is the sole operator of national TV MUXs) by leveraging its technical knowledge of infrastructure and network infrastructure, its market understanding and the technical expertise of its staff. A significant portion of the contracts of the Group with these customers are inflation-linked, taking into consideration that the decrease cannot be less than 0%. In the past, the Group has experienced a high rate of renewal for the contracts in this business segment, although there can be price pressure from customers when renegotiating contracts. The Group plans to continue working closely with regulatory authorities in relation to technological developments in both the TV and radio broadcasting markets and to leverage its existing infrastructure and customer relationships to obtain business in adjacent areas where it benefits from competitive advantages.
Operating Income from the Other Network Services segment increased its income by 9%, to EUR 112 million. The Group classifies the type of services that it provides in this segment in five groups: connectivity services, mission-critical and private network ("MC&PN") services, O&M, urban telecom infrastructure and optical fibre. "Connectivity services" include connectivity between different nodes of the telecommunication networks (backhaul) of the Group’s customers and/or connectivity with its customers’ premises (enterprise leased lines), using radio-links, fibre or satellite. The Group also provides specialised leased lines to telecom operators such as MNOs or FNOs, public administrations, and small and medium-sized enterprises as well as companies in rural areas of Spain offering high-speed connectivity. Under "MC&PN services", the Group operates seven regional and two municipal TETRA networks in Spain which are critical for the communication needs of regional governments and municipalities where the networks are located and a highly reliable Global Maritime Distress and Safety System (GMDSS) for the Maritime Rescue Service for the Safety of Life at Sea, which provides communication services to ships in distress and hazardous situations in the coastal areas around Spain. Under "O&M" the Group manages and operates infrastructure (as opposed to outsourcing it to third parties) and provides maintenance services for customer equipment and infrastructure to the Group’s customers (other than its broadcasting customers that are serviced by the Broadcasting Infrastructure segment). Through urban telecom infrastructure, the Group provides communications networks for smart cities and specific solutions for efficient resource and service management in cities. Under "optical fibre" the Group uses optical fibre to connect its, or its customers’, infrastructure (macro cells, DAS and Small Cells) and edge-computing facilities. When the main customer of such business is the public administration, rather than an MNO, this business is reported under the Other Network Services business segment. The Group’s main customers for its connectivity services are BT, Orange Spain, COLT, and Vodafone. Connectivity contracts usually have an initial term of three years and the fees charged are linked to the number of circuits deployed and the capacity used. Please note that, like Broadcasting Infrastructure, Other Network Services are only provided in Spain.
The transactions performed during 2021 and 2022, especially in the Telecom Infrastructure Services business segment, helped boost Operating Income and Operating Profit, the latter also being impacted by the measures to improve efficiency and optimise operating costs. Regarding land, which is the most important cost item, the Group carries out Cash Advances, which are prepayments to landlords related to specific long-term contracts that allow Cellnex to reduce its annual recurring payments and extend the duration of the contracts, basically in order to obtaining efficiencies. Cash Advances made to landlords during the year ended on 31 December 2022 amount to EUR 132,708 thousand (EUR 70,640 thousand in 2021), and approximately 6% of these cash advances cover a lease period of 10 years or less (some 8% in 2021).
In line with the increase in revenue, Adjusted EBITDA was 37% higher than at the 2021 year-end, reflecting the Group’s capacity to generate cash flows on a continuous basis.
In this context of intense growth, the “Depreciation, amortisation and results from disposals of fixed assets” expense has increased substantially, by 38% compared to the 2021 year-end, as a result of the higher fixed assets (property, plant and equipment, and intangible assets) in the accompanying consolidated balance sheet, following the business combinations undertaken during the second half of 2021 and during 2022.
Moreover, the net financial loss increased by 20%, derived largely from the new bond issuances carried out during the first half of 2022 and the 2021 year end. On the other hand, the income tax for 2021 included the effect of the Reverse Big Merger (see Note 18 to the accompanying Consolidated Financial Statements), which resulted in a positive impact of EUR 60 million in the consolidated income statement for the year. On 1 April 2022, the merger of CK Hutchison Networks Italia S.p.A. and Towerlink Italia S.r.l. into Cellnex Italia SpA was completed, with Cellnex Italia S.p.A. being the surviving entity. Furthermore, on 1 July 2022, the merger of Towerco S.p.A. and Iaso Gruppo Immobiliare S.r.l. into Cellnex Italia SpA was completed with Cellnex Italia S.p.A. being the surviving entity (collectively the "Big Merger II Transaction"). The merger difference was determined at the effective accounting date (backdated to 1 January 2022) as the excess of i) the cost of the investments and ii) their respective equity. The entire merger difference was allocated to goodwill in Cellnex Italia SpA’s individual financial statements, which are prepared under Italian generally accepted accounting standards (GAAP). With regards to the goodwill generated by the Big Merger II Transaction, Cellnex Italia SpA will opt to step-up the tax basis of the goodwill, for which payment of the substitute tax (“imposta sostitutiva”) is required in order to generate the corresponding tax deduction of the amortisation, with payments for three years in 2024, 2025 and 2026 amounting to EUR 91 million, EUR 125 million and EUR 96 million, respectively.
Therefore, the net loss attributable to the parent company on 31 December 2022 amounted to EUR 297 million due to the substantial effect of higher amortisations and financial costs associated with the intense acquisition process and the consequent geographical footprint expansion, as mentioned above. This scenario remains consistent with the current strong growth that the Group continues to experience and, as mentioned in the 2021 Annual Results Presentation, the Group expects to continue experiencing a net loss attributable to the parent company in the coming quarters.
Total assets at 31 December 2022 stood at EUR 44,258 million, a 6% increase compared with the 2021 year-end, due mainly to i) the acquisitions in Portugal (the Hivory Portugal Acquisition) and in the UK (the Hutchison United Kingom Acquisition) (see Note 6 to the accompanying consolidated financial statements), partly compensated by ii) the payment for the transaction with non-controlling interests of On Tower France and On Tower Poland. Around 84% of total assets concern property, plant and equipment and other intangible assets, in line with the nature of the Group’s business related to the management of terrestrial telecommunications infrastructure.
Thus, total investments made in 2022 amounted to EUR 7,472 million, partly for investments in shareholdings of companies due to the acquisition in Portugal and in the United Kingdom, as well as the acquisition of minority stakes in On Tower France and On Tower Poland (see Note 2.h to the accompanying consolidated financial statements). Investments have also been carried out relating to business expansion that generate additional Recurring Leveraged Free Cash Flow (including decommissioning, telecom site adaptation for new tenants and prepayments of land leases), as well as expansion Capital Expenditures related to committed Build-to-Suit programmes and Engineering Services with various clients (see Note 8 to the accompanying consolidated financial statements). Moreover, over this period the Group has also invested in maintaining its infrastructure and equipment keeping sites in good working order, which is key to maintaining a high level of service. Finally, during 2022, the Group completed the Divestment Remedy with UK telecommunications infrastructure operator Wireless Infrastructure Group (“WIG”), required for the completion of the Hutchison United Kingdom Acquisition. The sites have been transferred for an amount of approximately GBP 135 million (see Note 7 of the accompanying consolidated financial statements). As of 31 December 2022, EUR 42 million are pending to be collected and will be collected during the coming quarters.
Consolidated net equity at 31 December 2022 stood at EUR 15,188 million, a -4% decrease compared with the 2021 year-end, owing largely to the acquisition of an additional stake in On Tower France and in On Tower Poland. Since the aforementioned transaction was an equity transaction carried out with a non-controlling interest in the subsidiary that did not modify the controlling position, the transaction led to the recognition of a negative impact under “Reserves of consolidated companies” in the accompanying consolidated balance sheet (see Note 14 to the accompanying consolidated financial statements), partially offset by the issue of shares payment for the Hutchison United Kingdom Acquisition, among others. See Note 6 to the accompanying consolidated financial statements.
The Group's net financial debt as at 31 December 2022 stood at EUR 19,838 million compared with EUR 14,609 million at the end of 2021 (restated). Likewise, on 31 December 2022, Cellnex had access to immediate liquidity (cash & undrawn debt) to the tune of approximately EUR 4.5 billion (EUR 8.7 billion at the end of 2021).
Regarding the Corporate Rating, on 31 December 2022, Cellnex holds a long-term “BBB-” (Investment Grade) with stable outlook according to the international credit rating agency Fitch Ratings Ltd as confirmed by a report issued on 17 January 2023 and a long-term “BB+” with positive outlook according to the international credit rating agency Standard & Poor’s Financial Services LLC as confirmed by a report issued on 11 November 2022.
|
PoPs - Total +c.9%
|
PoPs - Organic Growth +c.6%
|
|
Revenues (€Mn) +c.38%
|
RLFCF (€Mn) +c.39%
|
Recurring Leveraged Free Cash Flow (please see section Milestones and Key Figures for 2022 of this Annual Integrated Report) organic growth generation in the year ended December 31, 2022 amounted to 204 million euros (please see full year 2022 results presentation), driven by a number of contributors: i) BTS program execution (approximately 84 million euros), ii) escalators or inflation (approximately 57 million euros), iii) Operating expenses, ground lease efficiencies and synergies (approximately 20 million euros) and, iv) New colocations and associated revenues (approximately 44 million euros). These are the assumptions that the management has taken into account:
Please see Note 17 to the accompanying Consolidated Financial Statements.
Please see Note 4 to the accompanying Consolidated Financial Statements.
Cellnex’s borrowing is represented by a combination of loans, credit facilities and bond issues. At 31 December 2022, the total limit of loans and credit facilities available was EUR 7,178,743 thousand (EUR 6,814,615 thousand as at 31 December 2021), of which EUR 3,885,212 thousand in credit facilities and EUR 3,293,530 thousand in loans (EUR 2,740,058 thousand in credit facilities and EUR 4,074,556 thousand in loans as at 31 December 2021).
|
Thousands of euros |
||||||
|
Notional as of 31 December 2022 (*) |
Notional as of 31 December 2021 (*) |
|||||
|
Limit |
Drawn |
Undrawn |
Limit |
Drawn |
Undrawn |
|
|
Bond issues and other loans |
14,215,194 |
14,215,194 |
— |
13,766,317 |
13,766,317 |
— |
|
Loans and credit facilities |
7,178,743 |
3,833,917 |
3,344,826 |
6,814,615 |
2,079,919 |
4,734,696 |
|
Total |
21,393,937 |
18,049,111 |
3,344,826 |
20,580,932 |
15,846,236 |
4,734,696 |
(1) Without including the “Lease liabilities” heading of the accompanying consolidated financial statements.
(*) These items include the notional value of each heading, and are not the gross or net value of the heading. See “Borrowings by maturity” of the Note 15 to the accompanying consolidated financial statements.
The following graph sets out Cellnex’s notional contractual obligations in relation to borrowings as at 31 December 2022 (EUR million):
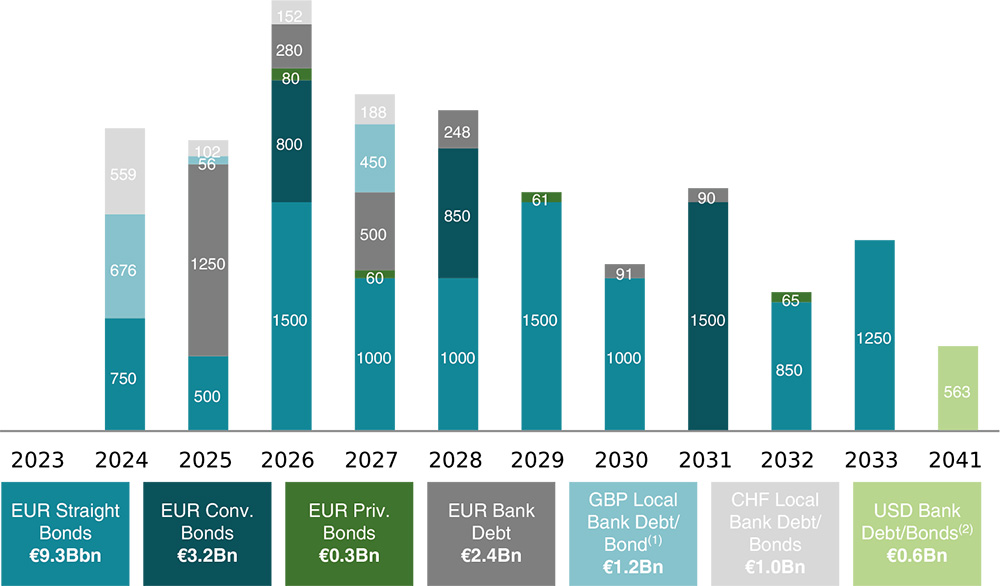
Key highlights
(1) Includes EUR bonds swapped to GBP.; (2) Includes USD bonds swapped to EUR. (3) Corresponds to Notional Debt.
In accordance with the financial policy approved by the Board of Directors, the Group prioritises securing sources of financing at Parent Company level. The aim of this policy is to secure financing at a lower cost and longer maturities while diversifying its funding sources. In addition, this encourages access to capital markets and allows greater flexibility in financing contracts to promote the Group’s growth strategy.
In July 2021, the Board of Directors of Cellnex Group, SA approved a new Tax Policy that reinforced and updated the Group's guiding principles in tax matters. The Policy is applicable to all Group entities and, consequently, is intended for all employees. The Cellnex Group’s new Tax Policy establishes the fundamental guidelines governing the decisions and actions of the Cellnex Group in tax matters, in line with the basic principle of regulatory compliance, i.e. due compliance with the tax obligations which the Group is required to meet in each of the countries and territories where it does business, fostering cooperative relationships with tax administrations based on the duties of transparency, good faith and loyalty, and mutual trust.
This Tax Policy replaces the first Group Tax Strategy approved in 2016.
It should be noted that Cellnex’s tax policy establishes, among other things, its commitment to pay any applicable taxes in all countries in which it operates and the alignment of its taxation with the effective performance of economic activities and value generation. As a consequence of this principle, the Cellnex Group is present in the territories where it operates purely for business reasons. Additionally, the Cellnex’s tax policy prohibits operating in territories considered as tax havens under Spanish law or included in the "European Union's black list of non-cooperative tax jurisdictions" in order to evade tax obligations which would otherwise be applicable. In this regard, the Cellnex Group companies are entities incorporated in European countries that are not listed as countries or territories classified as such.
Moreover, the same Board of Directors meeting in July 2021 approved the new Tax Risk Control and Management Standard, setting out the principles and structure of the tax risk control and management framework, in accordance with the new Tax Policy. In particular, this document brings together and lays down the principles and standards of action, internal processes and internal bodies aimed at mitigating and/or eliminating the different types of tax risks that can occur at Group level.
In addition, the deployment of the Tax Risk Control and Management System started at international level in 2021 and continued in 2022 with the roll-out of tax processes and controls to guarantee implementation of the Tax Control Framework following best practices in the field, gaining public interest and generating value for its shareholders by respecting and complying with tax regulations when making business decisions to avoid tax risks and inefficiencies.
Over the coming years, Cellnex will endeavour to improve the processes defined in 2021 by analysing of the various circumstances of the countries in which the Group has a presence. This review will lead to a better and more accurate Tax Control Framework, in line with best practices in relation to the management of tax risks.
In this context, and to guarantee the proper functioning, supervision and effectiveness of the Tax Control Framework, in July 2021 the Board of Directors also approved the incorporation of the Tax Compliance Committee. This new body reports to the Audit and Risk Management Committee and is structured as a collegiate body made up of a Chairperson, three Members and a Technical Secretary (with no voting rights). While the three Members belong to the Cellnex Group, the Chairperson is an independent tax expert with extensive and recognised standing in the tax field.
The Tax Compliance Committee is required to promote and assess the correct implementation and efficacy of the Cellnex Tax Risks Control and Management System, and to enable the prevention, detection, management and mitigation of tax risks.
To do so, the Tax Compliance Committee supervises the planning and implementation of the processes and procedures necessary to meet the established requirements of the Tax Risks Control and Management System, which must be reviewed and controlled periodically, and ensures that tax compliance objectives are being met.
Cellnex is fully committed to transparency in tax matters and to fostering a relationship with tax authorities based on the principles of mutual trust, good faith, transparency, collaboration and loyalty, and has been recognised as one of the top IBEX-35 companies in terms of tax transparency by Fundación Haz in its annual report "Contribución y Transparencia 2021", being awarded the top three-star rating.
In particular, and with regard to Spain, in September 2020, the Board of Directors of Cellnex Telecom, SA approved its adoption of the Code of Good Tax Practice of the Spanish Tax Authorities. In line with the principles of cooperative relationship with the Tax Authorities and transparency provided for in the Group’s Tax Policy, in 2022 the Cellnex Group submitted the Tax Transparency Report for the year 2021 (in 2021, the 2020 Tax Transparency Report was also submitted, (see the list of entities that have submitted the Tax Transparency Report). Although submission is not compulsory for entities or Groups adopting the Code, the Cellnex Group considered that the submission of this report was essential to forge a strong two-way relationship with the Spanish Tax Authorities.
Furthermore, looking at other territories where the Cellnex Group has a presence, in September 2021 it was appointed the Senior Accounting Officer for certain UK entities of the Group, its main duties being the adoption of reasonable steps to ensure that the Group establishes and maintains appropriate tax accounting arrangements. Additionally, the Senior Accounting Officer must monitor the arrangements and identify any aspects in which these fall short of the requirement.
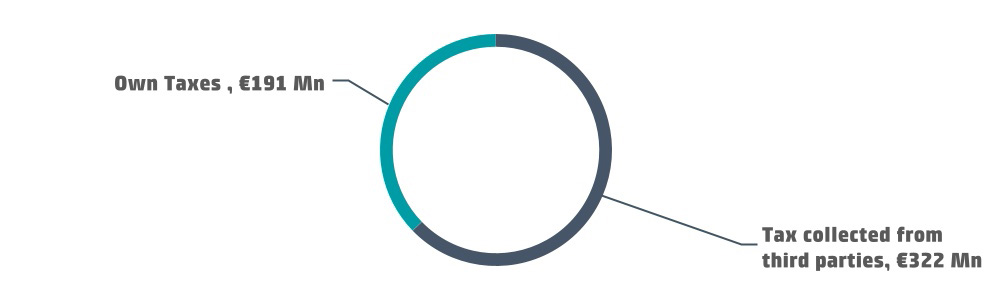
Cellnex is also sensitive to and aware of its responsibility for the economic development of the territories in which it operates, helping to create economic value by paying taxes, both on its own account and those collected from third parties. Accordingly, it makes a substantial effort and pays close attention to fulfilling its tax obligations, in accordance with the applicable rules in each territory.
|
Tax contribution in 2022 €513 Mn
|
Following the OECD's cash basis methodology, Cellnex's total tax contribution in 2022 was EUR 513 million (EUR 510 million in 2021). Own taxes are those borne by the Group and those of third parties are those that are collected and paid to the various tax authorities on behalf of such third parties, and therefore do not represent a cost for the Group.
|
CELLNEX TAX CONTRIBUTION |
(millions of euros) |
|||||
|
31 December 2022 |
31 December 2021 |
|||||
|
Own taxes(1) |
Tax collected from third parties(2) |
Total |
Own taxes(1) |
Tax collected from third parties (2) |
Total |
|
|
Spain |
37 |
75 |
112 |
26 |
77 |
103 |
|
Italy |
25 |
73 |
98 |
102 |
52 |
153 |
|
France |
30 |
42 |
72 |
51 |
4 |
55 |
|
Netherlands |
11 |
20 |
31 |
4 |
15 |
20 |
|
United Kingdom |
40 |
35 |
75 |
30 |
6 |
36 |
|
Switzerland |
9 |
7 |
16 |
4 |
7 |
11 |
|
Ireland |
4 |
9 |
13 |
10 |
9 |
19 |
|
Portugal |
2 |
18 |
20 |
12 |
17 |
29 |
|
Austria |
— |
3 |
3 |
— |
5 |
5 |
|
Sweden |
5 |
7 |
12 |
2 |
6 |
8 |
|
Denmark |
— |
2 |
2 |
— |
4 |
4 |
|
Poland |
28 |
31 |
59 |
51 |
16 |
67 |
|
Total |
191 |
322 |
513 |
292 |
218 |
510 |
(1) Includes taxes that represent an effective cost for the Group (basically includes payments of income tax, local taxes, various rates and employers' social security contributions).
(2) Includes taxes that do not affect the result, but are collected by Cellnex on behalf of the tax authorities or are paid on behalf of third parties (they basically include the net value-added tax, with deductions from employees and third parties and employees'social security contributions).
The reconciliation of the heading “Income Tax Payment” from the Consolidated Statement of Cash Flows for the year ended on 31 December 2022 and 2021, with “Income tax” in the Consolidated Income Statement is as follows:
|
Thousands of euros |
||
|
Income tax payment |
31 December 2022 |
31 December 2021 |
|
Current tax expense 24 |
(24,358) |
(120,725) |
|
Payment of income tax prior year |
(22,164) |
(29,542) |
|
Receivable of income tax prior year |
9,143 |
9,009 |
|
Income tax (receivable)/payable |
2,790 |
47,858 |
|
Non-recurring Income tax paid 25 |
(7,342) |
(78,400) |
|
Others |
(53,997) |
6,230 |
|
Payment of income tax as per the Consolidated Statement of Cashflows |
(95,928) |
(165,570) |
The breakdown of the income tax payment by country for the 2022 financial year is as follows:
|
BREAKDOWN OF THE INCOME TAX PAYMENT BY COUNTRY |
(millions of euros) |
|||||||||
|
31 December 2022 |
31 December 2021 |
|||||||||
|
Income from sales to third parties |
Income from intra-group operations with other tax jurisdictions |
Tangible assets other than cash and cash equivalent |
Corporate income tax accrued on gains/losses |
Corporate income tax paid |
Income from sales to third parties |
Income from intra-group operations with other tax jurisdictions |
Tangible assets other than cash and cash equivalent |
Corporate income tax accrued on gains/losses |
Corporate income tax paid |
|
|
Spain |
569 |
96 |
887 |
14 |
9 |
530 |
34 |
851 |
53 |
(1) |
|
Italy |
736 |
1 |
1,605 |
13 |
9 |
512 |
1 |
1,281 |
92 |
16 |
|
France |
749 |
5 |
4,571 |
48 |
21 |
414 |
— |
3,153 |
80 |
39 |
|
Switzerland |
158 |
5 |
228 |
(6) |
9 |
146 |
— |
209 |
4 |
3 |
|
Netherlands |
130 |
5 |
148 |
(32) |
10 |
97 |
— |
153 |
6 |
3 |
|
Ireland |
57 |
2 |
193 |
(2) |
3 |
56 |
— |
168 |
1 |
3 |
|
United Kingdom |
386 |
9 |
858 |
133 |
15 |
312 |
1 |
325 |
(93) |
7 |
|
Portugal |
129 |
4 |
516 |
2 |
1 |
103 |
— |
247 |
3 |
11 |
|
Austria |
79 |
2 |
226 |
8 |
— |
73 |
— |
208 |
5 |
— |
|
Sweden |
56 |
1 |
142 |
6 |
5 |
49 |
— |
142 |
— |
2 |
|
Denmark |
36 |
2 |
87 |
3 |
— |
29 |
— |
70 |
— |
— |
|
Poland |
413 |
— |
1,234 |
3 |
7 |
213 |
— |
826 |
3 |
4 |
|
Total |
3,498 |
132 |
10,695 |
190 |
89 |
2,533 |
36 |
7,632 |
154 |
87 |
"It is truly gratifying to be part of a committed company and to be able to help and encourage Cellnex to achieve its environmental and social goals, which are crucial to creating a better world, through financing."
Susana Sánchez, Treasury Analyst - Cellnex CorporateAs part of the commitment to sustainability, Cellnex has designed a Sustainability-Linked Financing Framework to reinforce the role of sustainability as an integral part of the Group’s funding process.
The Framework is aligned with best practices as described by the International Capital Market Association’s (“ICMA”) Sustainability-Linked Bond Principles (“SLBP”) 2020 and the Loan Market Association’s (“LMA”) Sustainability-Linked Loan Principles 2021 (“SLLP”) and will also provide investors with further insights into Cellnex's sustainability strategy and commitments.
Cellnex’s Sustainability-Linked Financing Framework aims cover any upcoming Sustainability-Linked financings, whether through Sustainability-Linked Bonds, Sustainability-Linked Convertible Bonds, Sustainability-Linked Loans or other debt instruments such as credit facilities and derivatives, whose financial characteristics are linked with sustainability performance targets. All Sustainability-Linked financing instruments will be referred to collectively as sustainability-linked financings.
The Framework has been reviewed by Sustainalytics, providers of Second Party Opinions (SPO) which considers it to be aligned with the International Capital Markets Association's Sustainable Bond Principles 2020 and the Loan Market Association's Sustainable Lending Principles 2021.
Cellnex has selected two environmental KPIs and one social KPI, which are core, relevant and material to its business and industry and are aligned with its ESG Strategy.
|
Indicator |
Description |
Status 2022 |
Target 2025 |
Target 2030 |
|
KPI 1a |
Reduction in Scope 1, 2 and 3 from fuel and energy-related activities GHG emissions |
(79%) |
(45%) |
(70%) |
|
KPI 1b |
Reduction of absolute Scope 3 GHG emissions from purchased goods and services, and from capital goods |
(9%) |
(21%) |
_ |
|
KPI 2 |
Annual sourcing of renewable electricity |
77% |
100% |
_ |
|
KPI 3 |
Percentage of women in directors and senior management/manager roles |
27% |
30% |
_ |
During the year ended at 31 December 2022, the Group structured EUR 3.4 Bn Facilities linked to the Sustainability Framework for 5 years with two of the indicators included in the Framework. (see note 15).
The most up-to-date information on ESG financing programs is available in the "Debt programs" section of the corporate website. Additionally, Annex 8. Sustainable finance includes detailed information on the KPIs performance.
The Group communicated the resignation tendered by Mr. Tobias Martinez Gimeno, by letter dated 10 January 2023, as director of Cellnex and, therefore, as its Chief Executive Officer (CEO), with effect from 3 June 2023.
The Board has acknowledged the CEO's resignation and has put the necessary mechanisms in place for his succession. The choice of the final effective date will allow him to attend the Ordinary General Shareholders Meeting to examine the accounts for the 2022 financial year, initially scheduled for 1 June 2023.
On 27 February 2023, Cellnex Finance, as borrower, and Cellnex, as guarantor, entered into a EUR 700,000 thousand term loan facility agreement to refinance by means of a subsequent intra-Group financing between Cellnex Finance, as lender, and Cellnex UK, as borrower, the existing GBP 600,000 thousand term loan facility agreement entered into by Cellnex UK, as borrower, and Cellnex, as guarantor, on 5 November 2019 (as amended and restated on 9 December 2020 and on 23 December 2021). The new financing maintains an attractive interest expense while extending the average life of the Group’s debt.
In February 2023, the Group cancelled a Cross Currency Swap (“CCS”) for EUR 450 million and an equivalent sterling value of GBP 382 million which were designated together with the bond issue of EUR 450 million executed in January 2020 as a natural hedge of the net investment made in United Kingdom Group’s subsidiaries.
1 See note 20.a to the accompanying consolidated financial statements.
2 See note 20.b to the accompanying consolidated financial statements.
3 See note 20.c to the accompanying consolidated financial statements.
4 See note 20.e to the accompanying consolidated financial statements.
5 See note 20.d to the accompanying consolidated financial statements.
6 See note 20.a to the accompanying consolidated financial statements.
7 See note 20.a to the accompanying consolidated financial statements.
8 See note 20.a to the accompanying consolidated financial statements.
9 Adjusted Ebitda Margin = Adjusted Ebitda / (Operating Income – Passthrough)
10 See note 15 to the accompanying consolidated financial statements.
11 See note 15 to the accompanying consolidated financial statements.
12 See note 16 to the accompanying consolidated financial statements.
13 See note 11 to the accompanying consolidated financial statements.
14 See note 13.a to the accompanying consolidated financial statements.
15 See note 13.b to the accompanying consolidated financial statements.
16 See note 16 to the accompanying consolidated financial statements.
17 See note 20.d to the accompanying consolidated financial statements.
18 See note 20.f to the accompanying consolidated financial statements.
19 See note 20.f to the accompanying consolidated financial statements.
20 See note 13.a to the accompanying consolidated financial statements.
21 See note 13.b to the accompanying consolidated financial statements.
22 See note 20.a to the accompanying consolidated financial statements.
23 Margin = (Revenues - Capex) / Revenues
24 See note 18.b to the accompanying consolidated financial statements.
25 See note 18.b, section "The reverse merger transaction" to the accompanying consolidated financial statements.
Uso de cookies
Utilizamos cookies propias y de terceros para analizar nuestros servicios y mostrarle publicidad relacionada con sus preferencias. Pulsando “Configurar” puede seleccionar las cookies que se instalarán en su dispositivo. Pulsando “Aceptar” consiente su instalación y el uso de todas las cookies que utilizamos. Puede obtener más información aquí.
ACEPTAR COOKIES Configuración de cookies